3.12. Extension: Building and Predicting With A Regression Tree#
Building a regression tree is very similar to building a classification tree
using sklearn. Let’s first look at our dataset. icecream.csv
import pandas as pd

data = pd.read_csv("icecream.csv")
print(data)
Output
Temperature  Rain  Sales
0            22     0   3700
1            -2     0     50
2            31     0   6200
3            18     1    900
4            16     0   1300
5            24     1   3100
6            22     1   2500
7            28     0   5100
8            18     0   4200
9            21     0   2800
10           26     0   4100
11           29     1   5400
A Rain value of 0 indicates no rain, and a Rain value of 1 indicates it did rain.
To build our regression tree we import DecisionTreeRegressor instead of
DecisionTreeClassifier.
In this example, instead of limiting height, we’ve set min_samples_split =
6, which means a node must contain at least 6 samples for the node to be
split by a further decision.
tree = DecisionTreeRegressor(min_samples_split=n_samples)
The other change we’ve made is that in export_graphviz, we no longer need
to provide the class_names, since we aren’t predicting classes. Here is a
complete example.
import pandas as pd
from sklearn.tree import DecisionTreeRegressor, export_graphviz
import graphviz

data = pd.read_csv("icecream.csv")
x = data[["Temperature", "Rain"]].to_numpy()
y = data["Sales"].to_numpy()

tree = DecisionTreeRegressor(min_samples_split=6)
tree.fit(x, y)

tree_data = export_graphviz(
    tree, feature_names=["Temperature", "Rain"], rounded=True, impurity=False
)
graph = graphviz.Source(tree_data)
graph.render("Tree", format="png")
Output
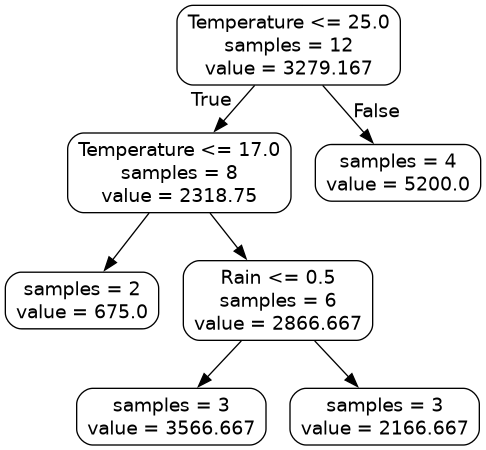
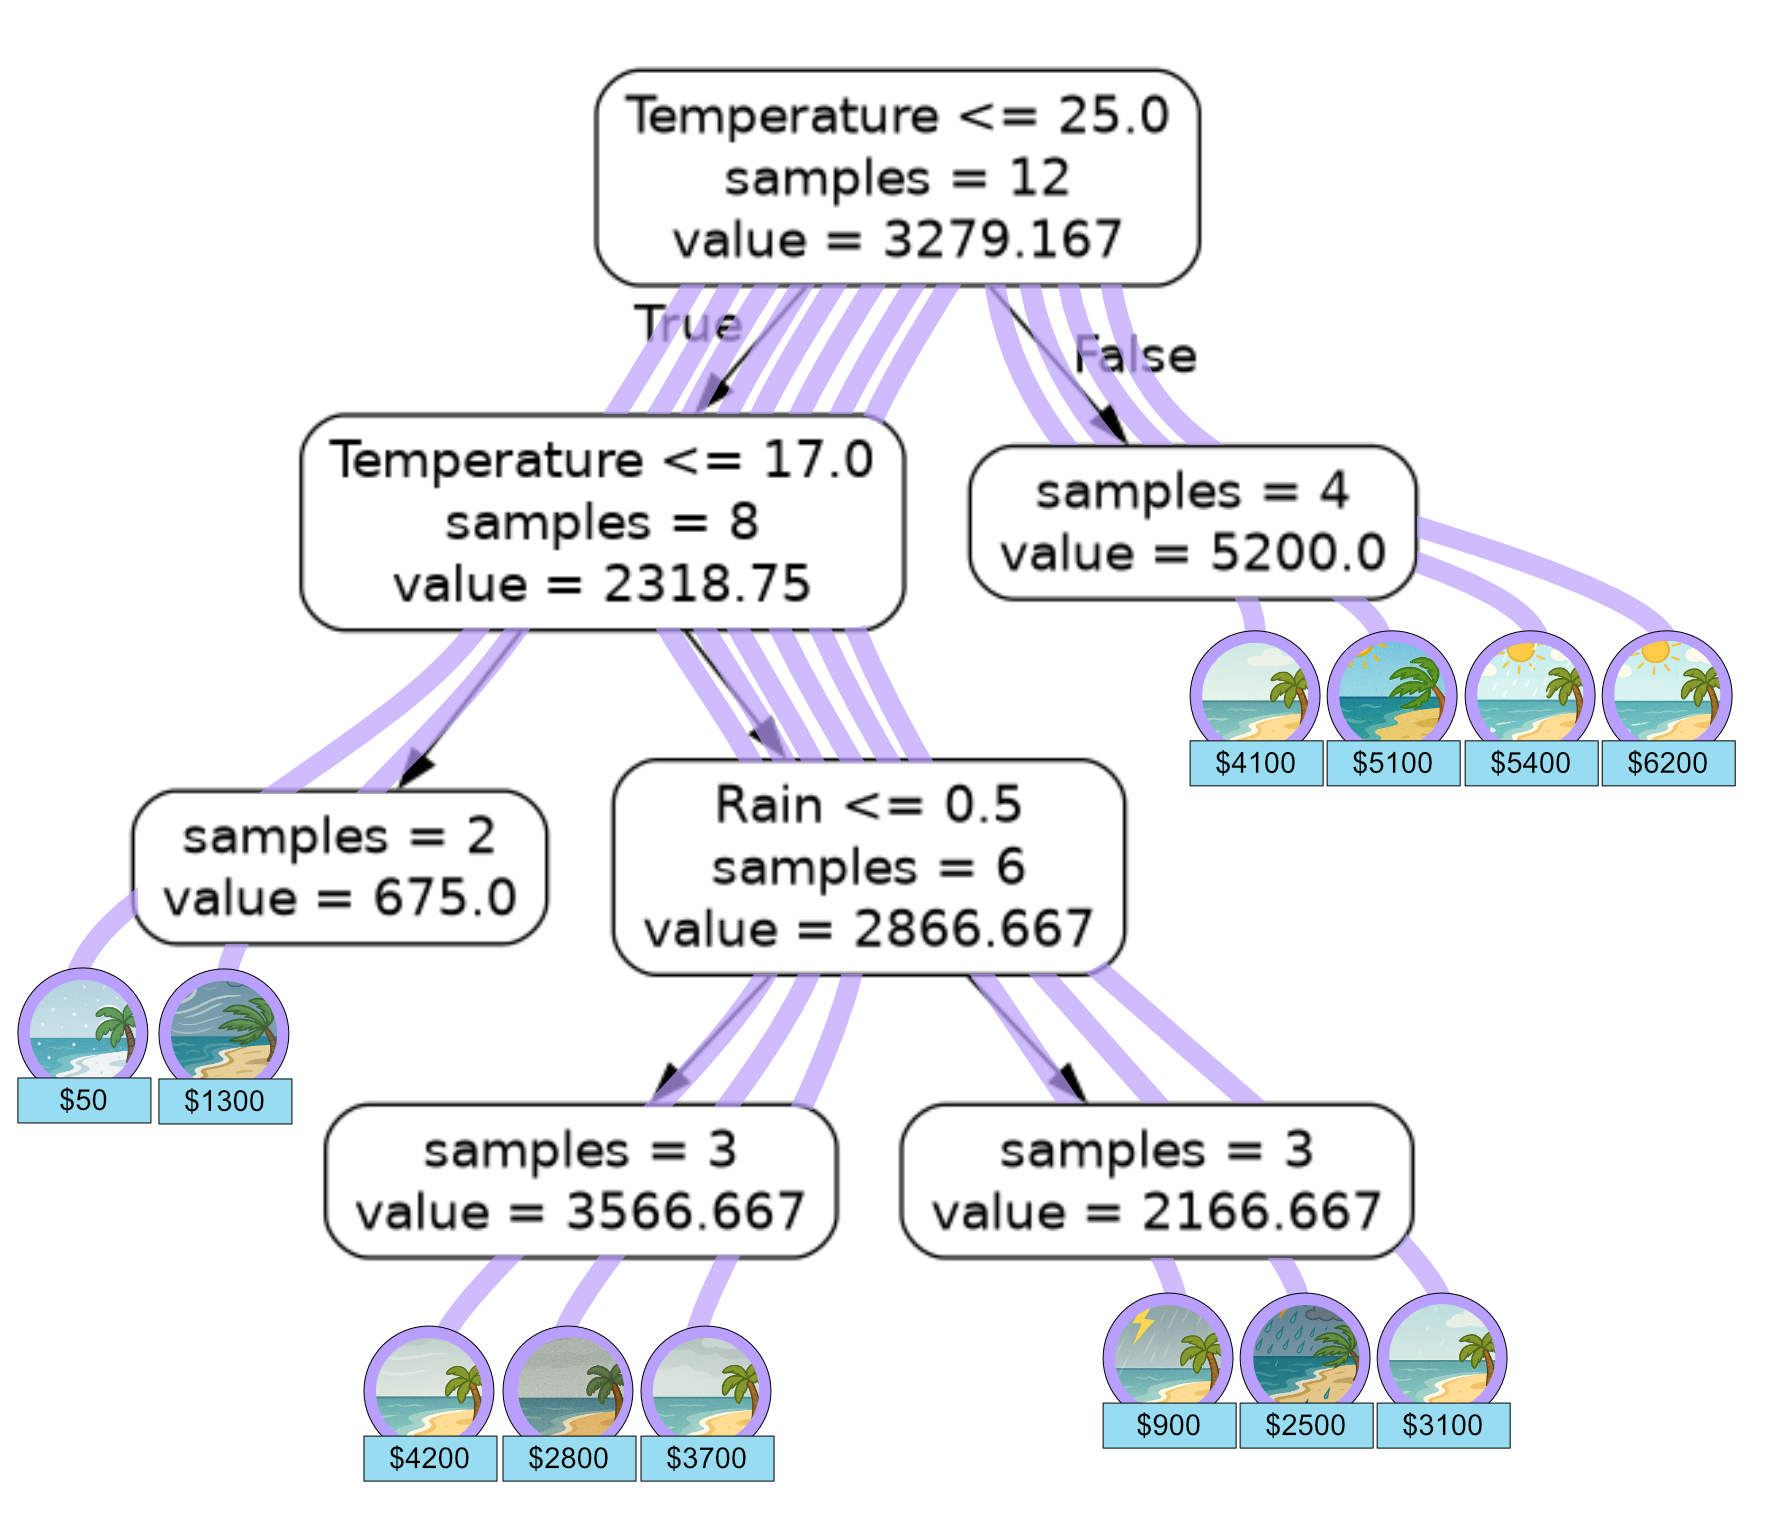
Here is a graphic showing how our training set flowed through the regression tree.
We can also use our model to predict ice cream sales on our test data using
.predict() and calculate the mean squared error using
mean_squared_error from sklearn.
import pandas as pd
import numpy as np
from sklearn.tree import DecisionTreeRegressor
from sklearn.metrics import mean_squared_error as mse
data = pd.read_csv("icecream.csv")
x = data[["Temperature", "Rain"]].to_numpy()
y = data["Sales"].to_numpy()
tree = DecisionTreeRegressor(min_samples_split=6)
tree.fit(x, y)
# temp, rain
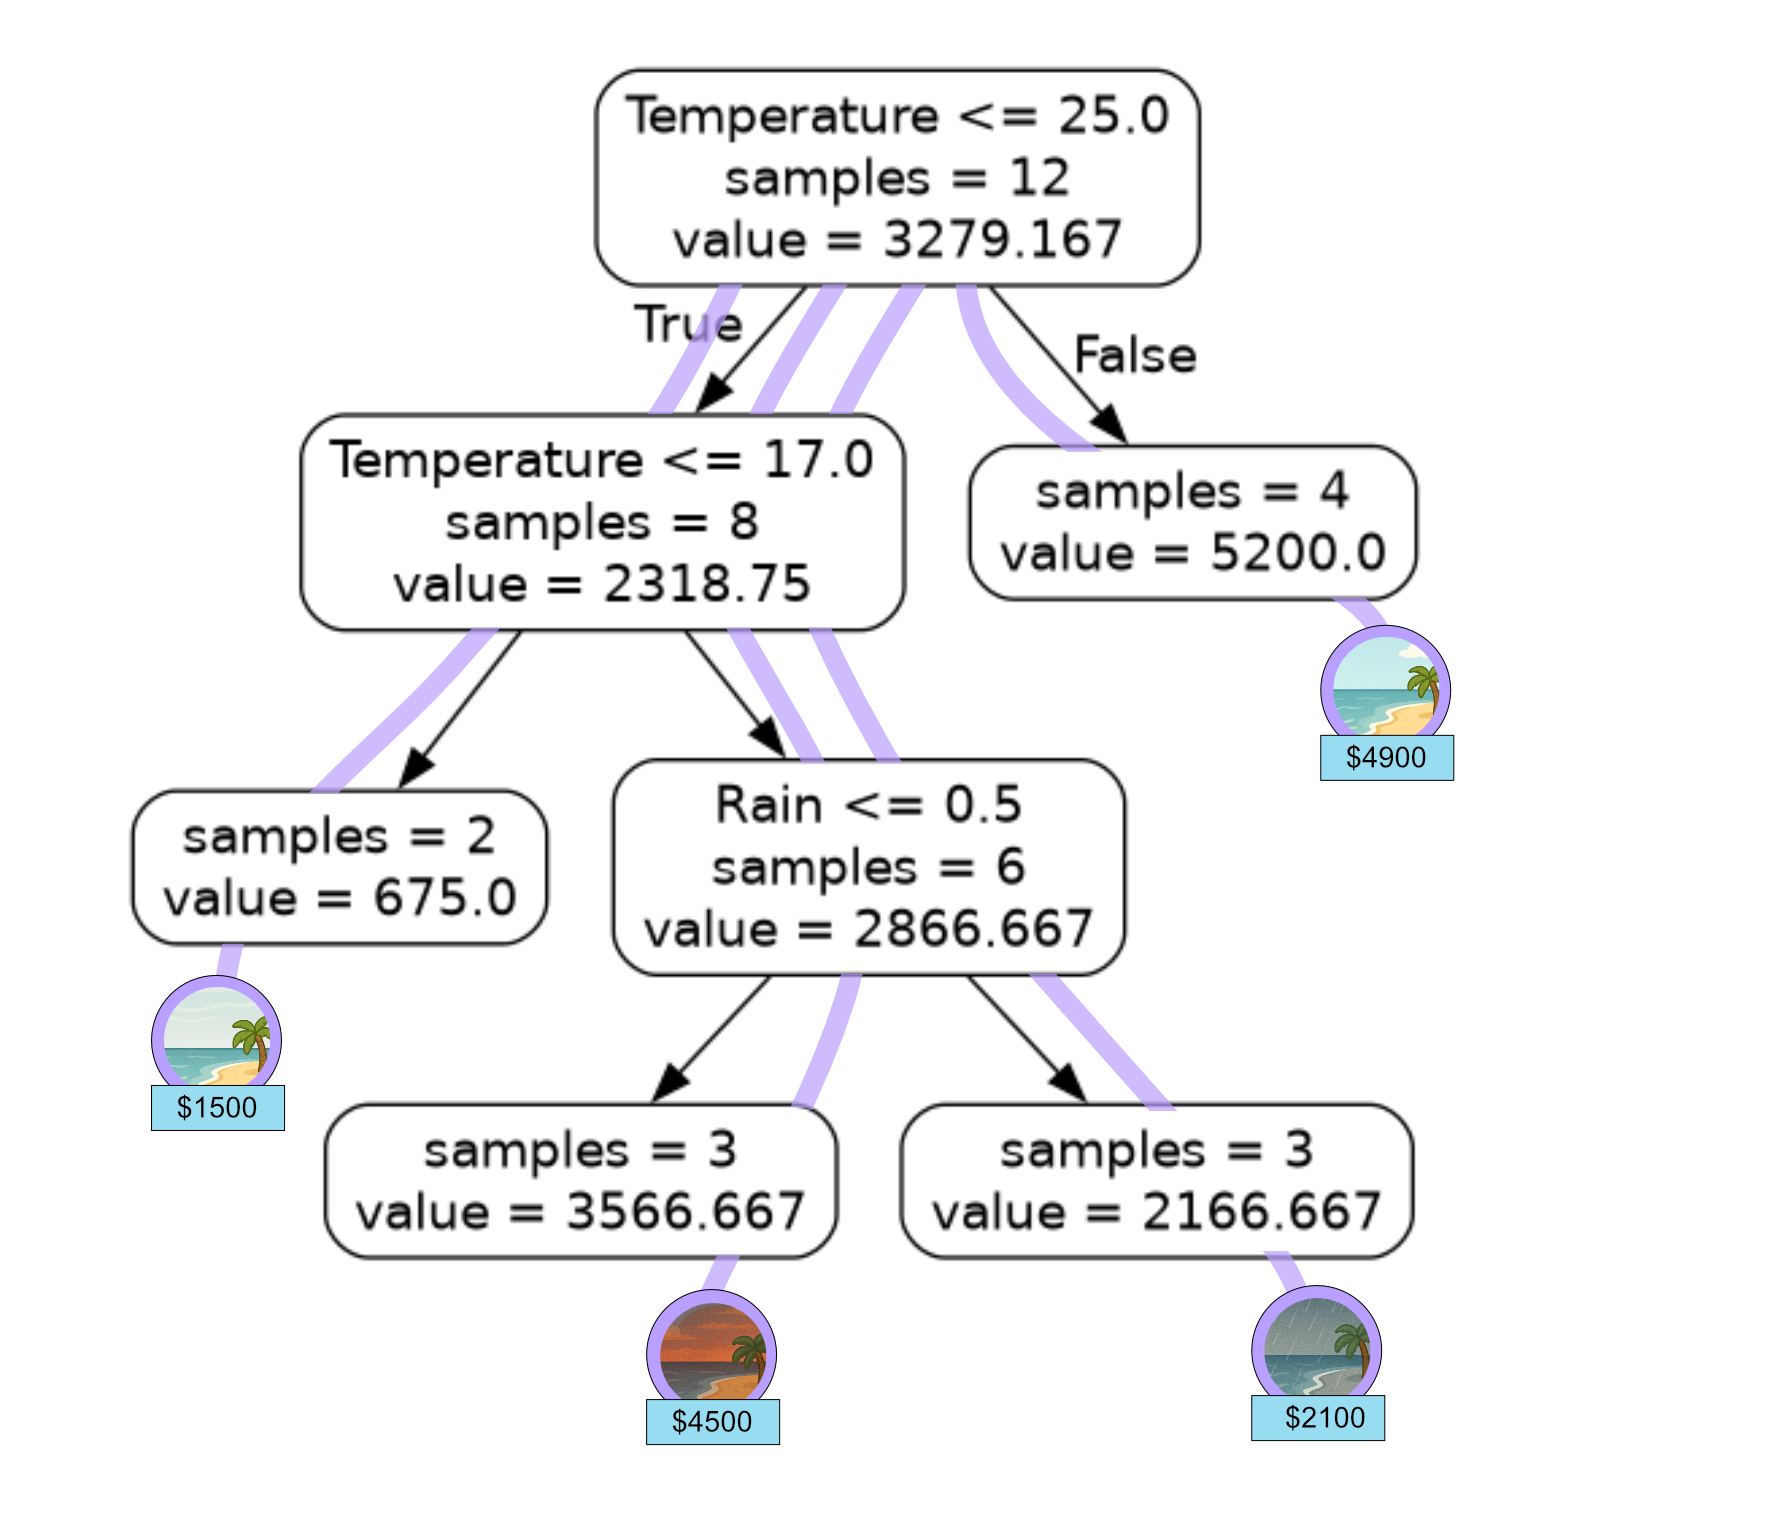
x_test = np.array([[21, 1], [26, 0], [13, 0], [18, 0]])
sales = np.array([2100, 4900, 1500, 4500])
prediction = tree.predict(x_test)
print("Predictions: {}".format(prediction))
print("MSE: {}".format(mse(sales, prediction)))
Output
Predictions: [2166.66666667 5200.          675.         3566.66666667]
MSE: 411545.13888888893
We can verify our models predictions by looking at how the test samples flow through our regression tree.
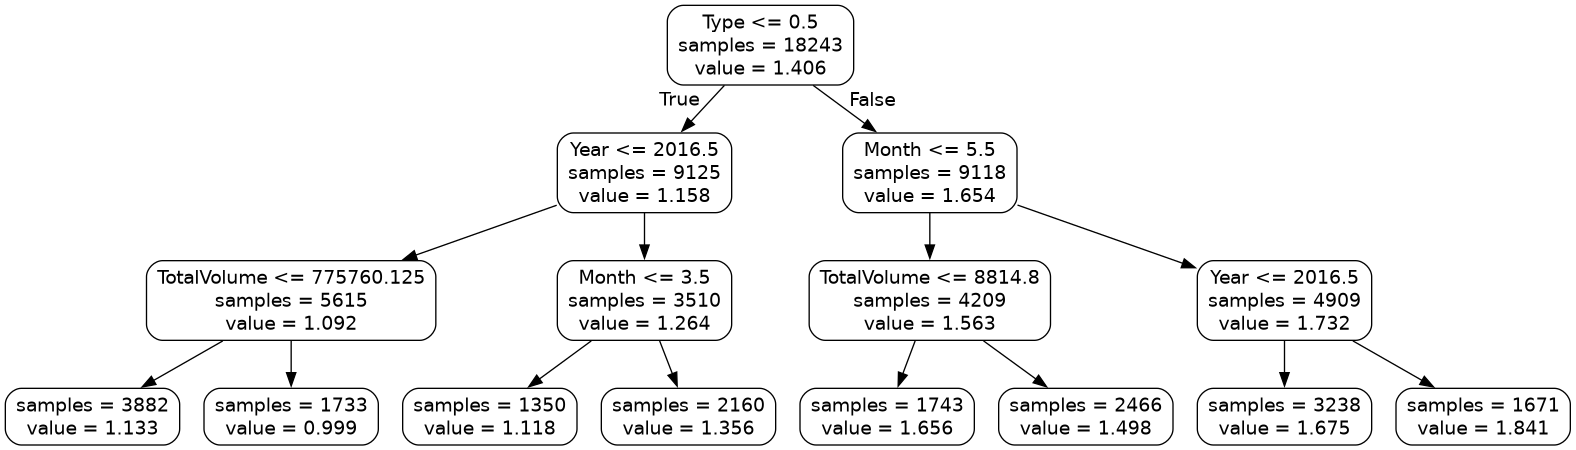
Code Challenge: Extension: Build a Regression Tree
You have been provided with a csv file called avocado.csv
with data from Kaggle . This data contains the following columns:
Month
TotalVolume
Type
Year
AveragePrice
The TotalVolume is the volume of avocados sold that day. The Type columns values 0 or 1, where 0 means conventional and 1 means organic.
We will use this data to predict AveragePrice, which is the average price of an avocado on a given day.
Instructions
Using pandas, read the file
avocado.csvinto aDataFrameExtract the
'Month','TotalVolume','Type','Year'columns into the variablexExtract the
'AveragePrice'column into the variableyConvert both
xandyto numpy arraysUsing
sklearn, create aDecisionTreeRegressormodel to fit to the training data, set themax_depthto 3Export the tree using
export_graphvizand setrounded=Trueandimpurity=False
Save the tree as a png file.
Your figure should look like this:
Solution
Solution is locked
Code Challenge: Extension: Predicting With a Regression Tree
Now lets use the regression tree we just built on our avocado data avocado.csv to classify the avocados in our test data.
Month |
Total Volume |
Type |
Year |
Average Price |
|---|---|---|---|---|
7 |
190716 |
0 |
2015 |
1.05 |
3 |
1045450 |
1 |
2016 |
1.27 |
9 |
9883 |
1 |
2017 |
2.15 |
1 |
16205 |
1 |
2018 |
1.93 |
Instructions
Copy and paste in your code from ‘Extension: Build a Regression Tree’, just up to where you fit the regression tree
Create a
numpy arraycontaining the avocado data shown aboveUse
.predictto predict the class for each objectPrint the predictions
Calculate the mean squared error of your predictions and print the results
Your output should look like this:
Predictions: [X.XXXXXXXX X.XXXXXXXX X.XXXXXXXX X.XXXXXXXX]
MSE: X.XXXXXXXXXXXXXXXXX
Solution
Solution is locked