3.11. Predicting With a Regression Tree#
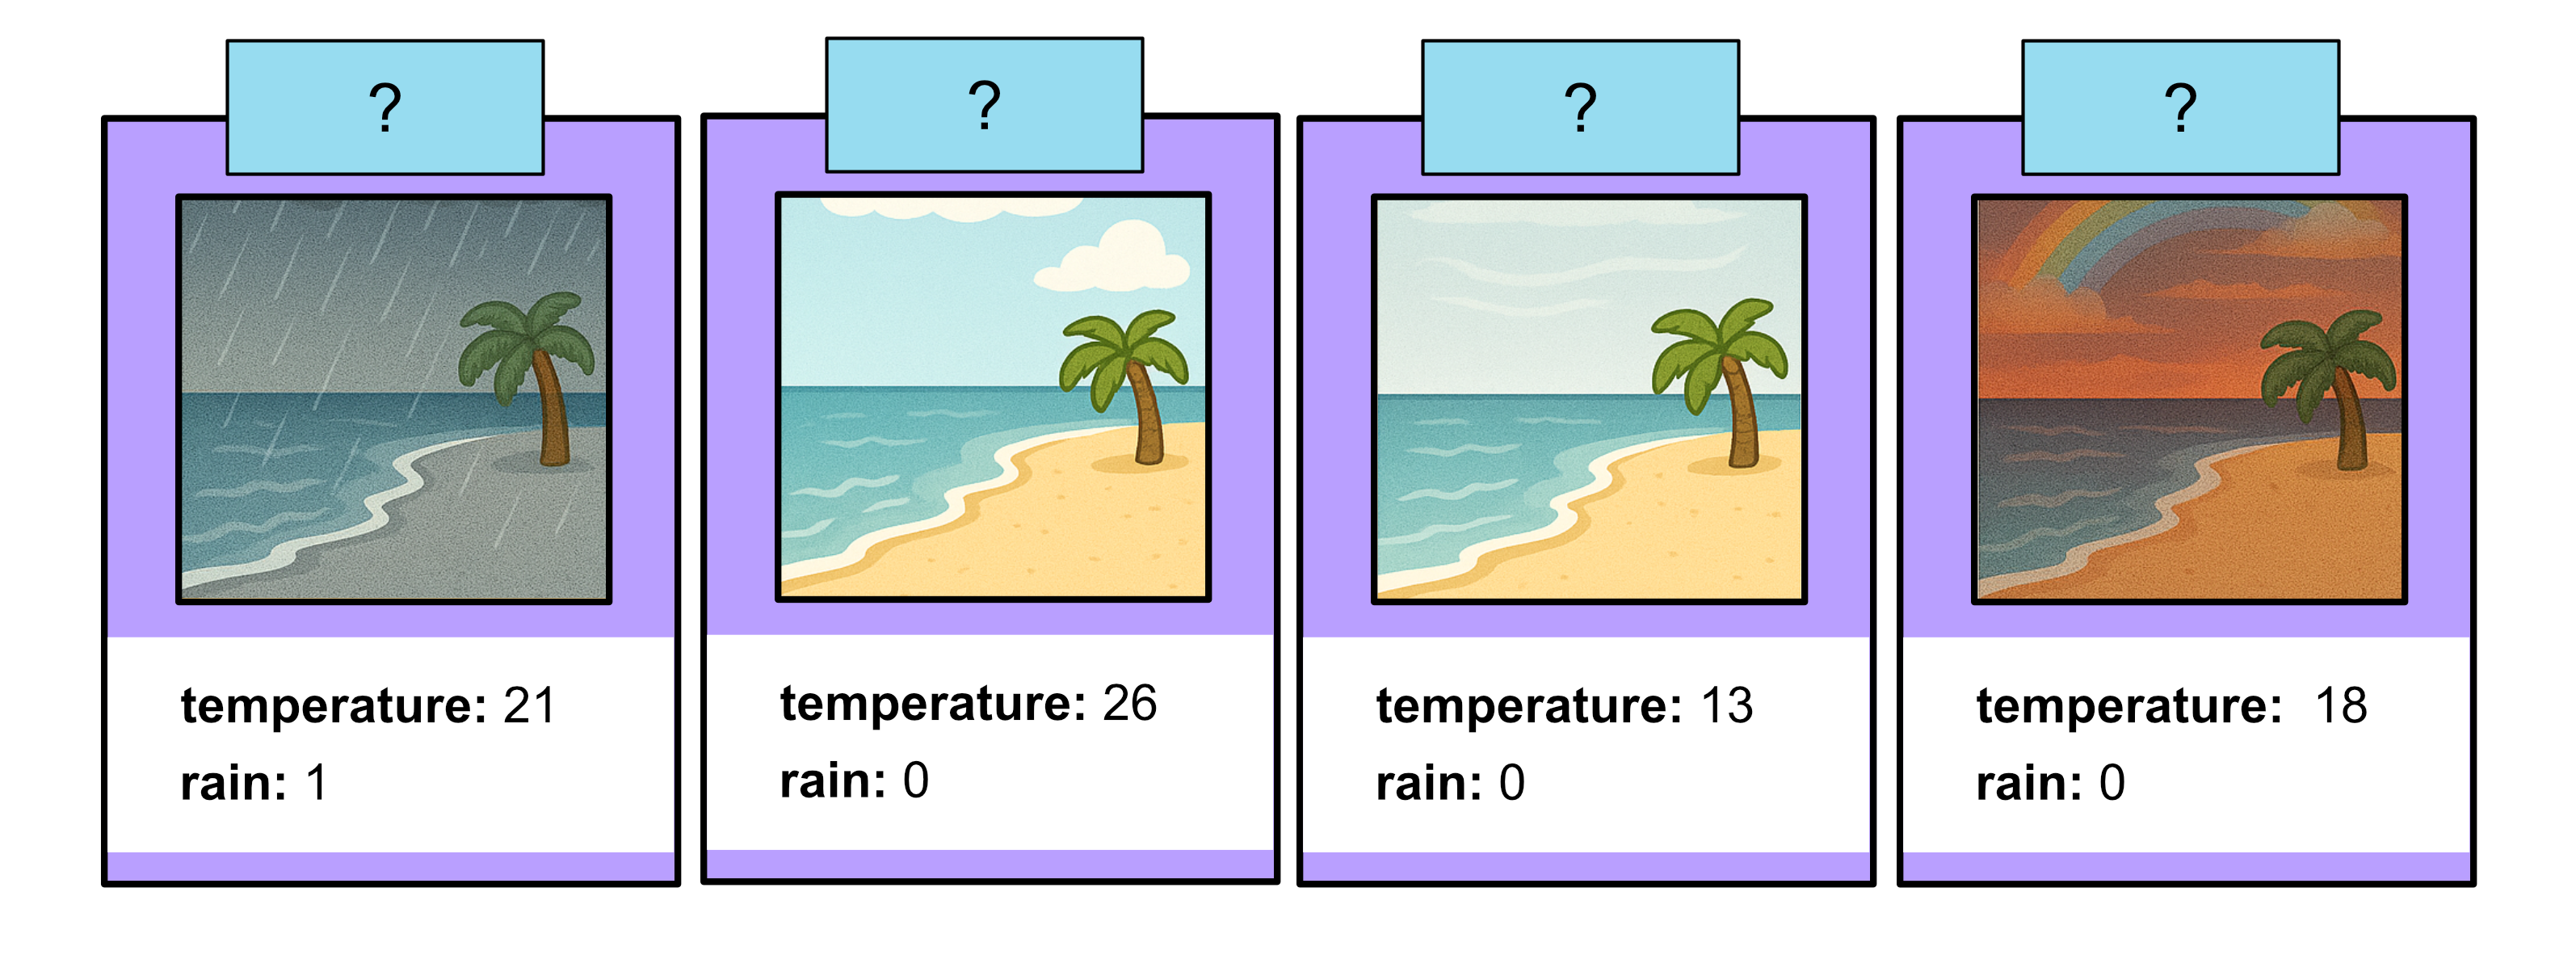
Consider the following test data:
Temperature (Celsius) |
Rain |
Sales ($) |
|---|---|---|
21 |
1 |
2100 |
26 |
0 |
4900 |
13 |
0 |
1500 |
18 |
0 |
4500 |
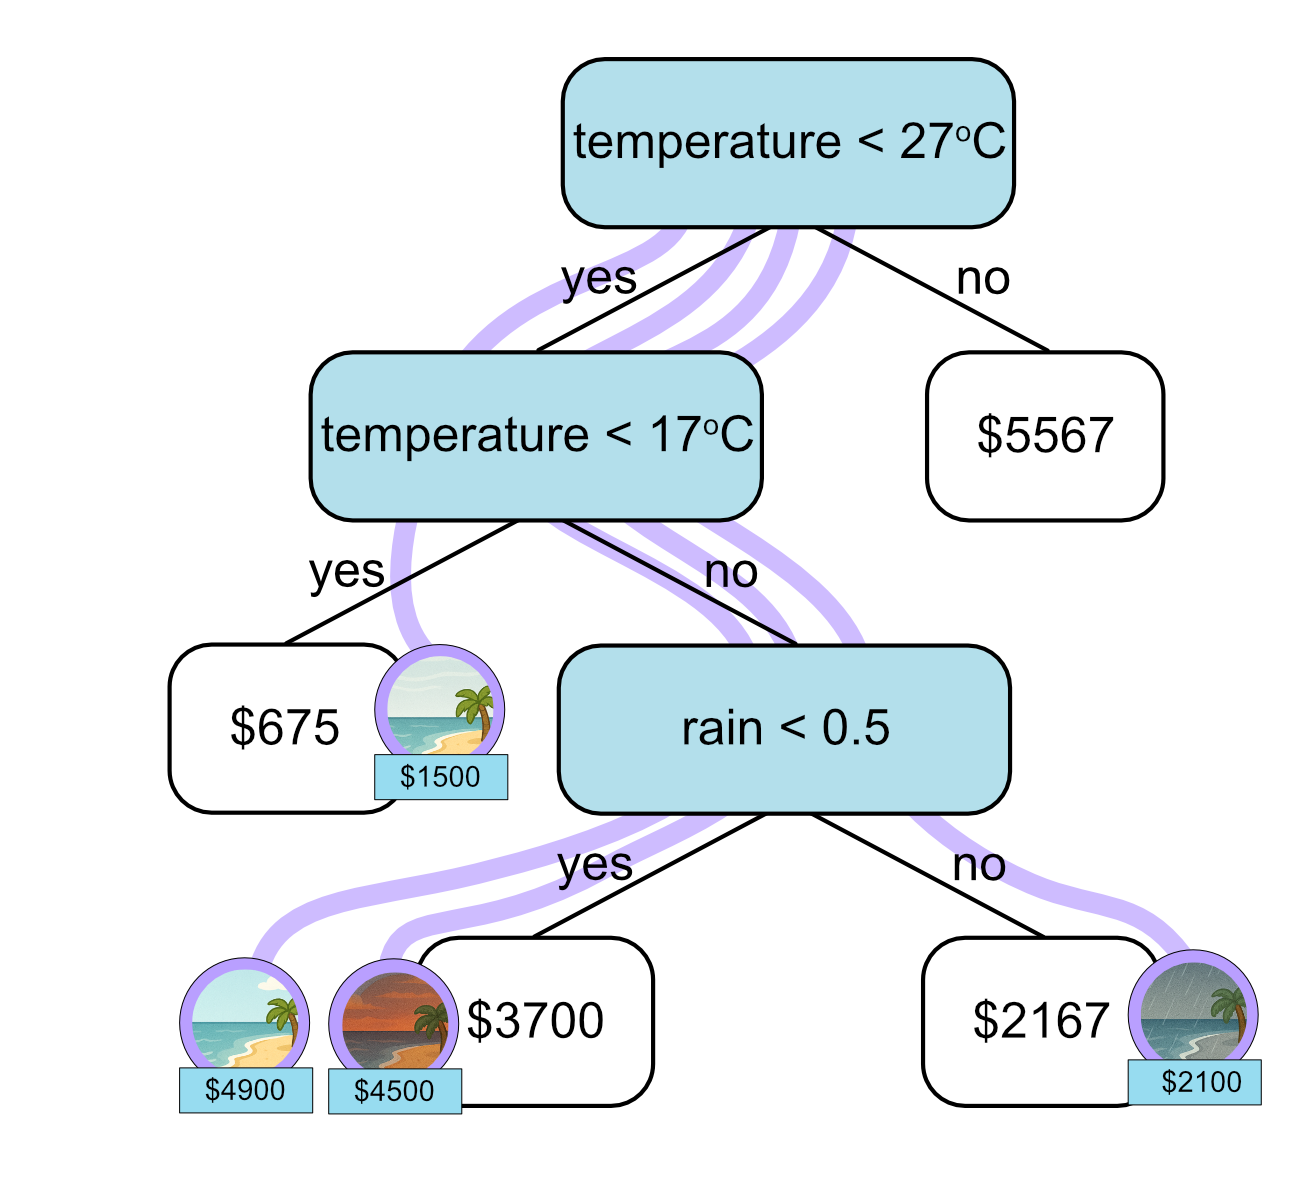
Let’s use our regression tree to predict the ice cream sales for each test sample.
Temperature (Celsius) |
Rain |
Actual Sales ($) |
Predicted Sales ($) |
|---|---|---|---|
21 |
1 |
2100 |
2167 |
26 |
0 |
4900 |
3700 |
13 |
0 |
1500 |
675 |
18 |
0 |
4500 |
3700 |
We can evaluate the performance of our model on the test data by calculating the mean squared error. Recall that to calculate the mean squared error we take the errors (predicted - actual), square them and then take the average.
\[\begin{split}\text{Mean Squared Error} &= \cfrac{1}{4}\left((2167 - 2100)^2 + (3700 - 4900)^2 + (675 - 1500)^2 + (3700 - 4500)^2\right)\\
&= \cfrac{1}{4}\left((67)^2 + (-1200)^2 + (-825)^2 + (-800)^2\right)\\
&= 691278.5\end{split}\]