4.16. Extension: Building a K-means Clustering Model#
Building a KNN model using sklearn is very similar to how we have built previous models.
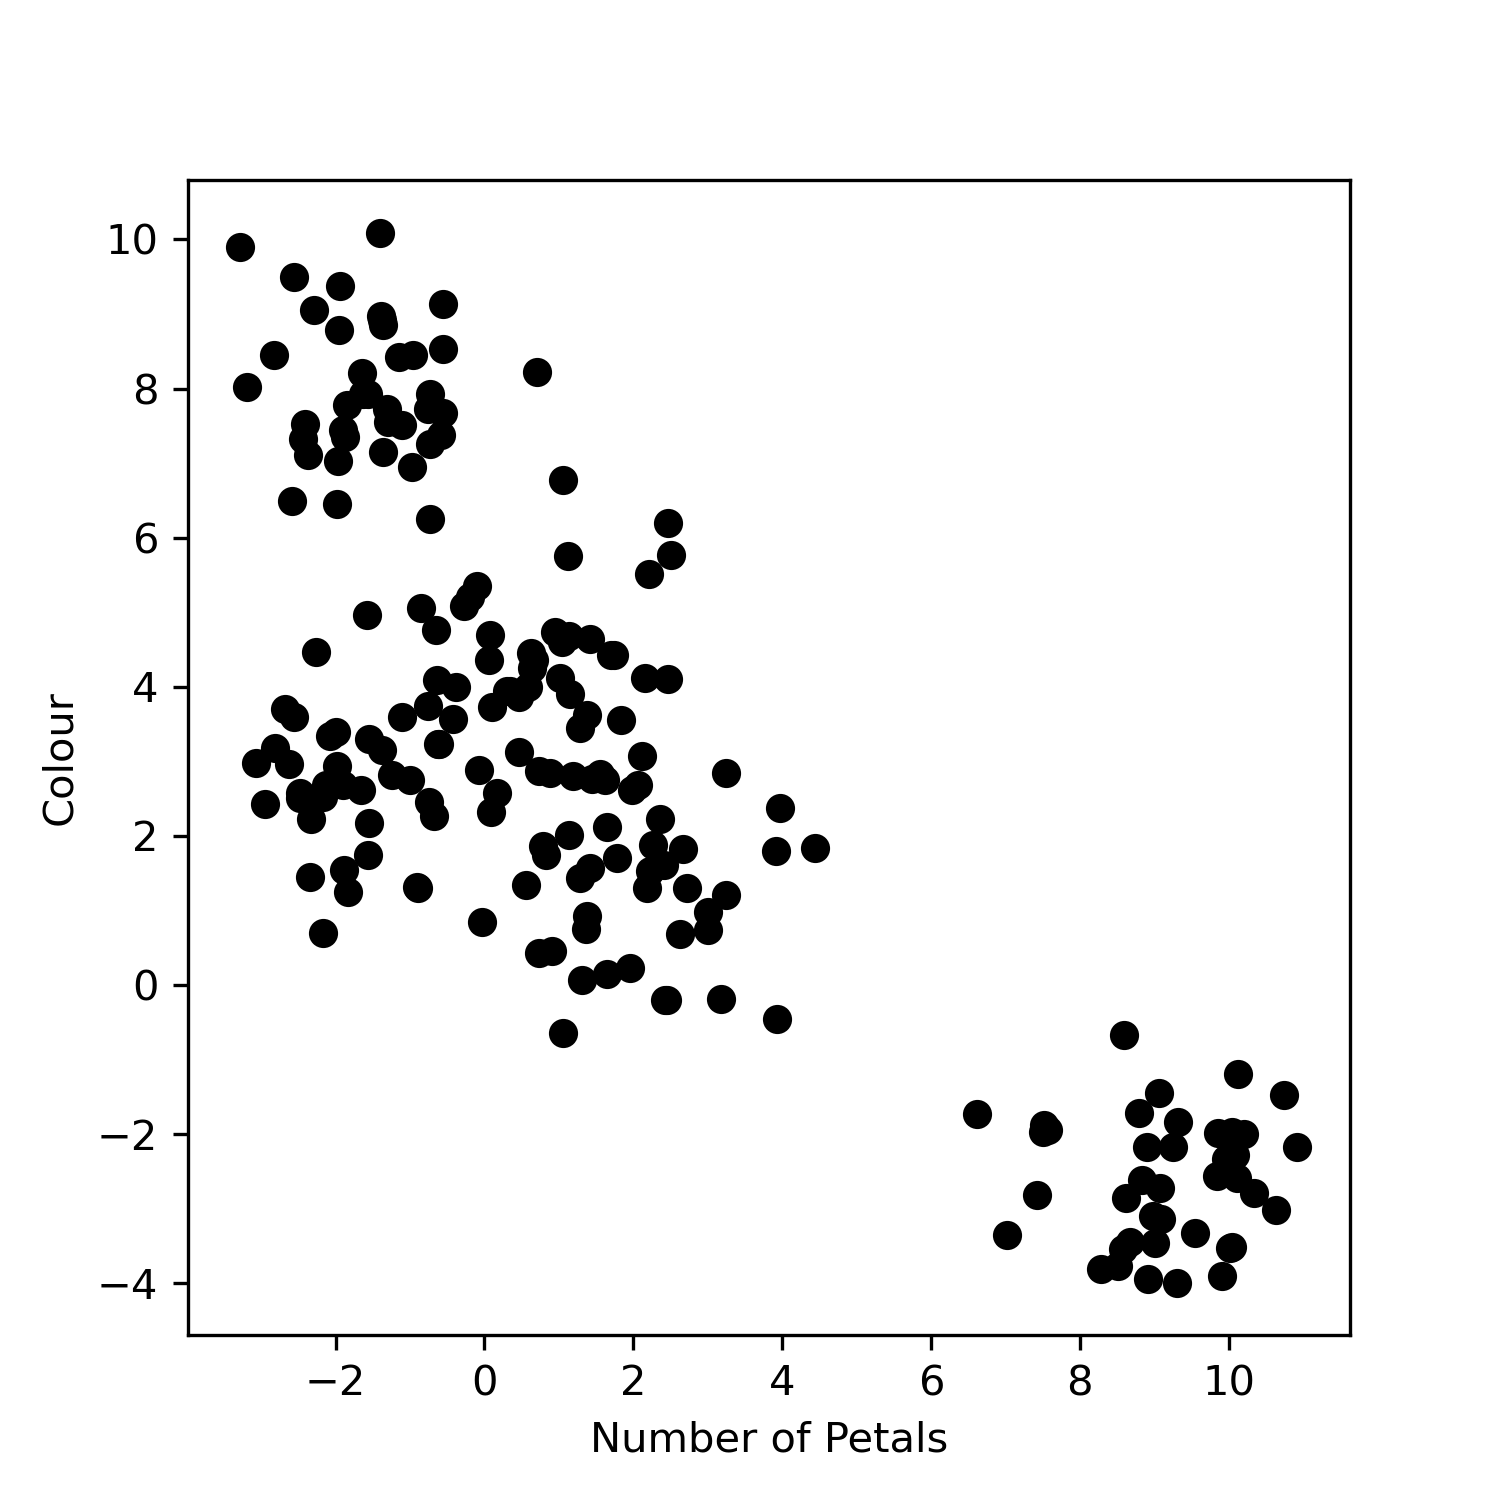
Let’s first look at our dataset flowers.csv. It contains flower information where for
each flower we have the number of petals and its colour. Note that this data
does not have labels, i.e. the flowers do not already have an allocated class.
import pandas as pd
import matplotlib.pyplot as plt

data = pd.read_csv("flowers.csv")

plt.scatter(data["Petals"], data["Colour"], color="black")
plt.xlabel("Number of Petals")
plt.ylabel("Colour")
plt.savefig("plot.png")
Output
To build a k-means clustering model we need to import the model.
from sklearn.cluster import KMeans
Then we create the model and specify the number of groups we want, i.e. the
value of n_clusters. For now we’ll set this to 3.
kmeans = KMeans(n_clusters=3)
We fit our model to the data using
kmeans.fit(data)
We can obtain the labels, i.e. the group assignments for each point using:
labels = kmeans.labels_
And we can obtain the coordinates of the centroids using:
centroids = kmeans.cluster_centers_
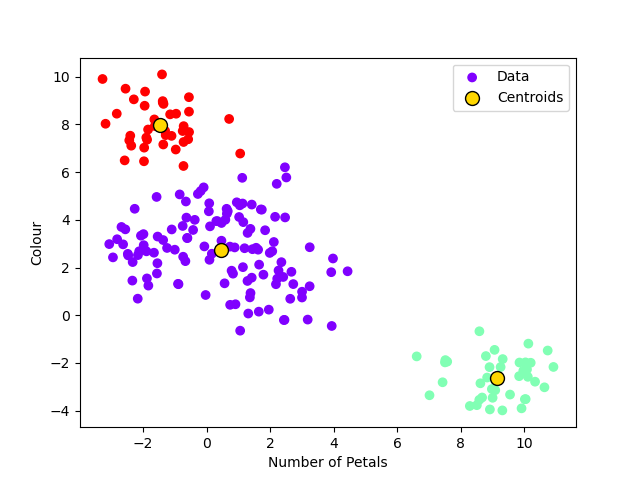
Below is a full example. We have introduced some additional code when it comes to plotting the data so that the colour of the datapoints indicate the group and also so you can visualise the centroids.
Note
Try experimenting with different values of k, i.e. changing the number of groups. It’s up to you to decide what you think the most appropriate value of k is!
import pandas as pd
import matplotlib.pyplot as plt
from sklearn.cluster import KMeans

data = pd.read_csv("flowers.csv").to_numpy()

kmeans = KMeans(n_clusters=3)
kmeans.fit(data)
labels = kmeans.labels_
centroids = kmeans.cluster_centers_

plt.scatter(data[:, 0], data[:, 1], label="Data", cmap="rainbow", c=labels)
plt.scatter(
    centroids[:, 0],
    centroids[:, 1],
    s=100,
    color="gold",
    edgecolors="black",
    label="Centroids",
)
plt.xlabel("Number of Petals")
plt.ylabel("Colour")
plt.legend()
plt.savefig("plot")
Output