3.8. Extension: Interpreting The Output Graph#
Let’s see how the training samples ‘flow’ through our classification tree.
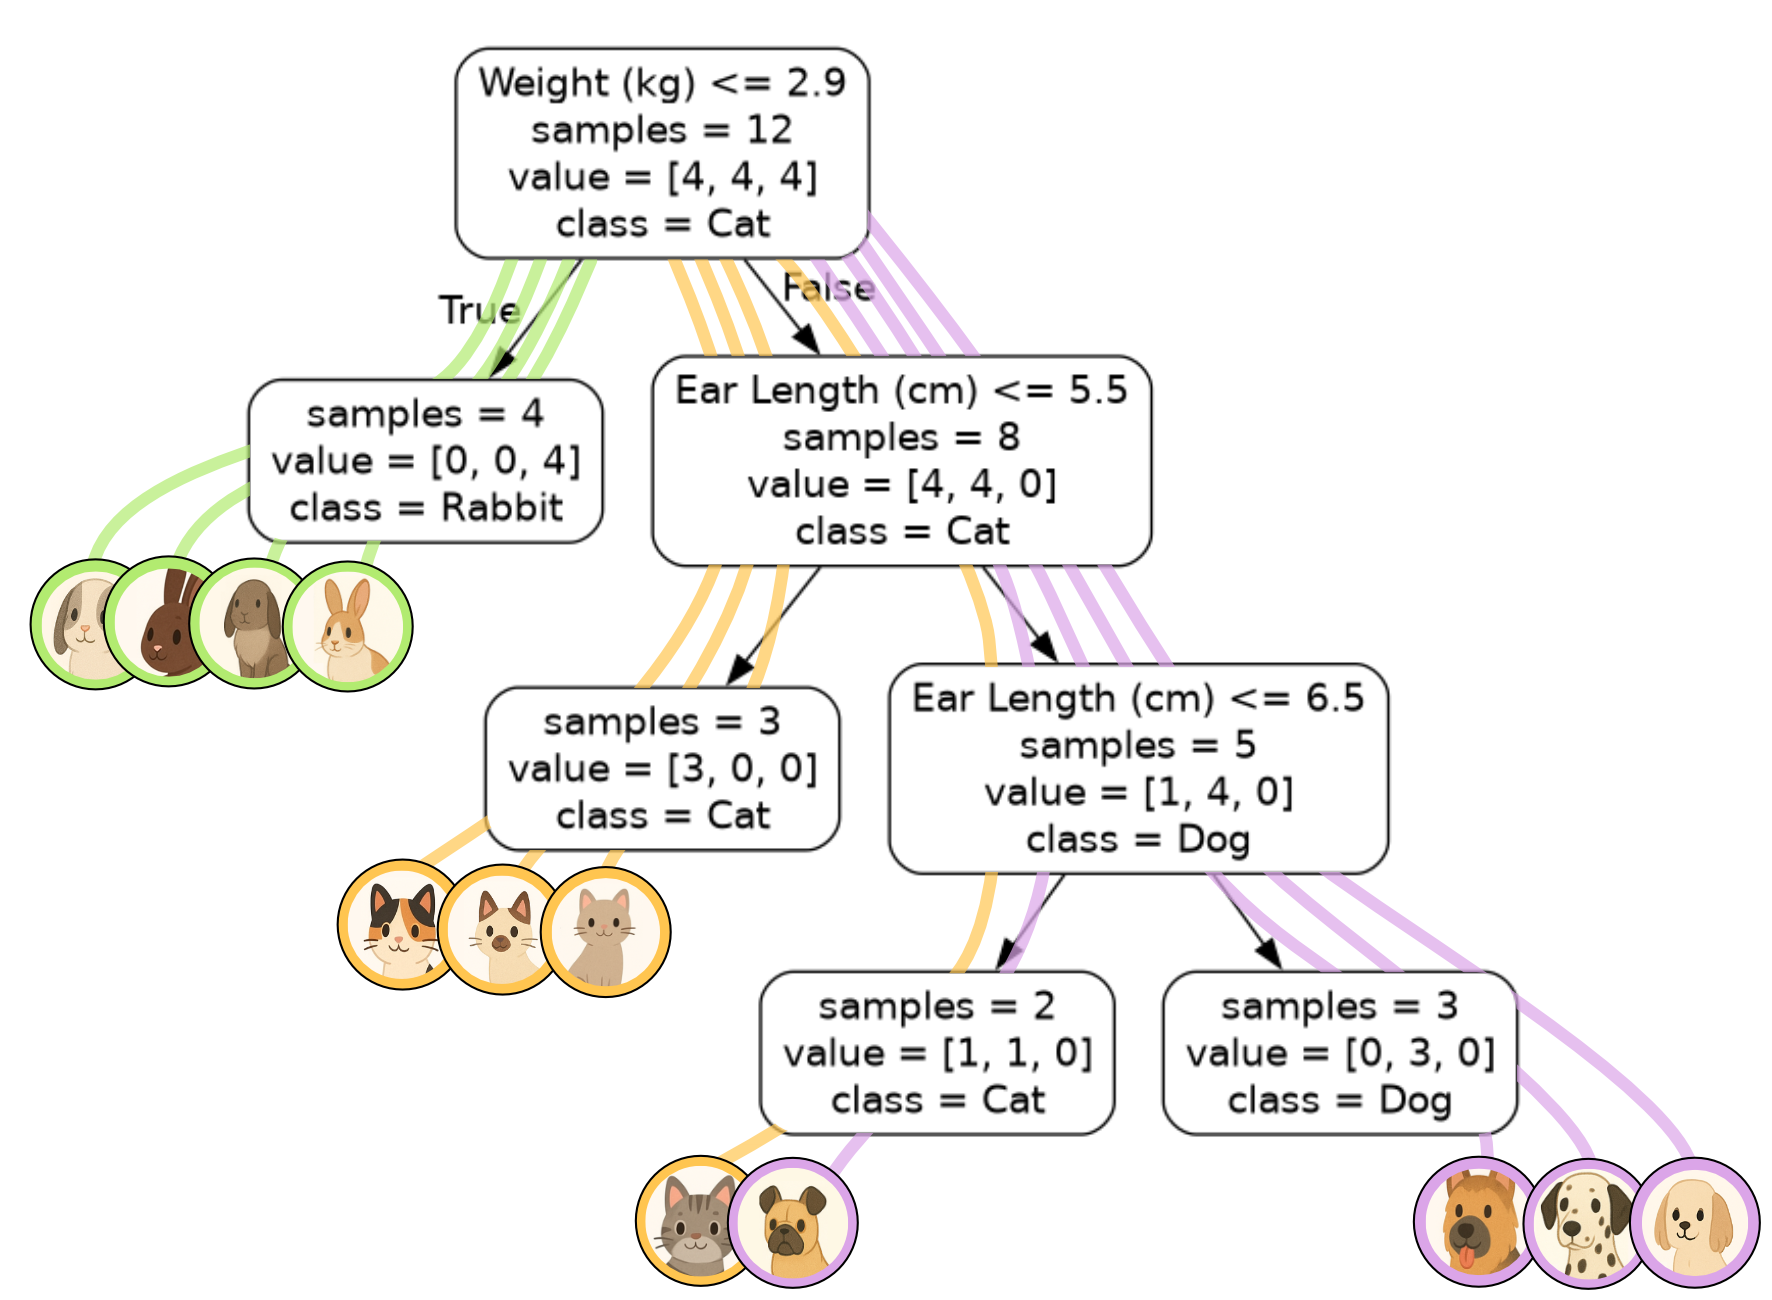
Let’s now focus in on one of the nodes.
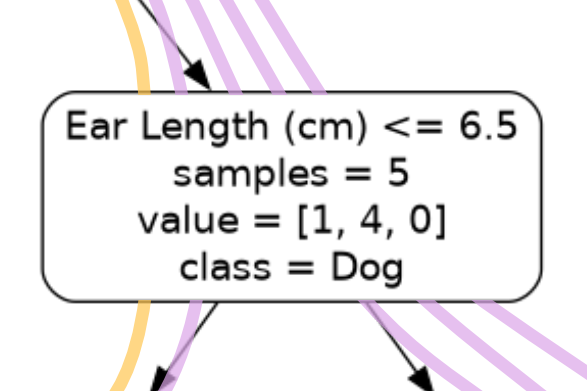
Ear Length (cm) <= 6.5is the decision associated with the node.samples = 5means that 5 samples have ‘flowed’ through this node. This corresponds to the 5 lines passing through the node in our visualisation.value = [1, 4, 0]tells you that there were 1 cat, 4 dogs and 0 rabbits that ‘flowed’ through this node. Again, you can tell by the colours of the lines. There is one yellow line for the cat and 4 purple lines for the dogs. The order of the list corresponds to the order of the class labels. In our case we had 1: cat, 4: dog, 0:rabbit.class = Dogmeans that the majority of the samples passing through this node belong to the dog class. In instances where there is a tie between classes, the class associated with the lowest number will be selected. E.g.[4, 4, 0]has equal cats (0) and dogs (1), so we default to cats.
Code Challenge: Extension: Building a Classification Tree
You have been provided with a csv file called astronomy.csv with data sourced from Wikipedia. This data contains the following columns:
Name
Mass (Earths)
Density (g/cm^3)
Class
The Class column values are, 0: Moon, 1: Planet, 2: Dwarf planet.
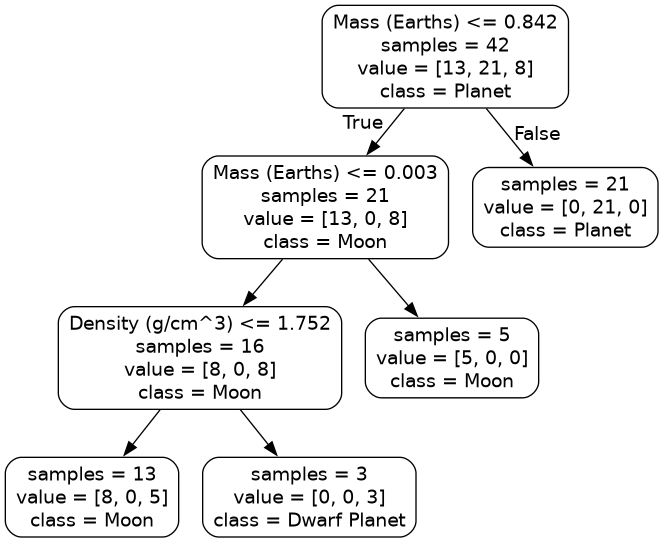
We will use this data to build a classification tree that can classify astronomical objects as a moon, planet or dwarf planet.
Instructions
Using pandas, read the file
astronomy.csvinto aDataFrameExtract the
'Mass (Earths)'and'Density (g/cm^3)'columns into the variablexExtract the
'Class'column into the variableyConvert both
xandyto numpy arraysUsing
sklearn, create aDecisionTreeClassifiermodel to fit to the training data, set themax_depthto 3Export the tree using
export_graphvizand set rounded=True andimpurity=FalseSave the tree as a png file.
Your figure should look like this:
Solution
Solution is locked