1.14. Multiple Linear Regression#
Thus far, we have been looking at simple linear regression. This is when the model we are working with only has 1 input variable. Simple linear regression models are of the form
where \(x\) is your input variable and \(y\) is the value you are trying to predict.
In multiple linear regression we have multiple input variables. These linear regression models are of the form
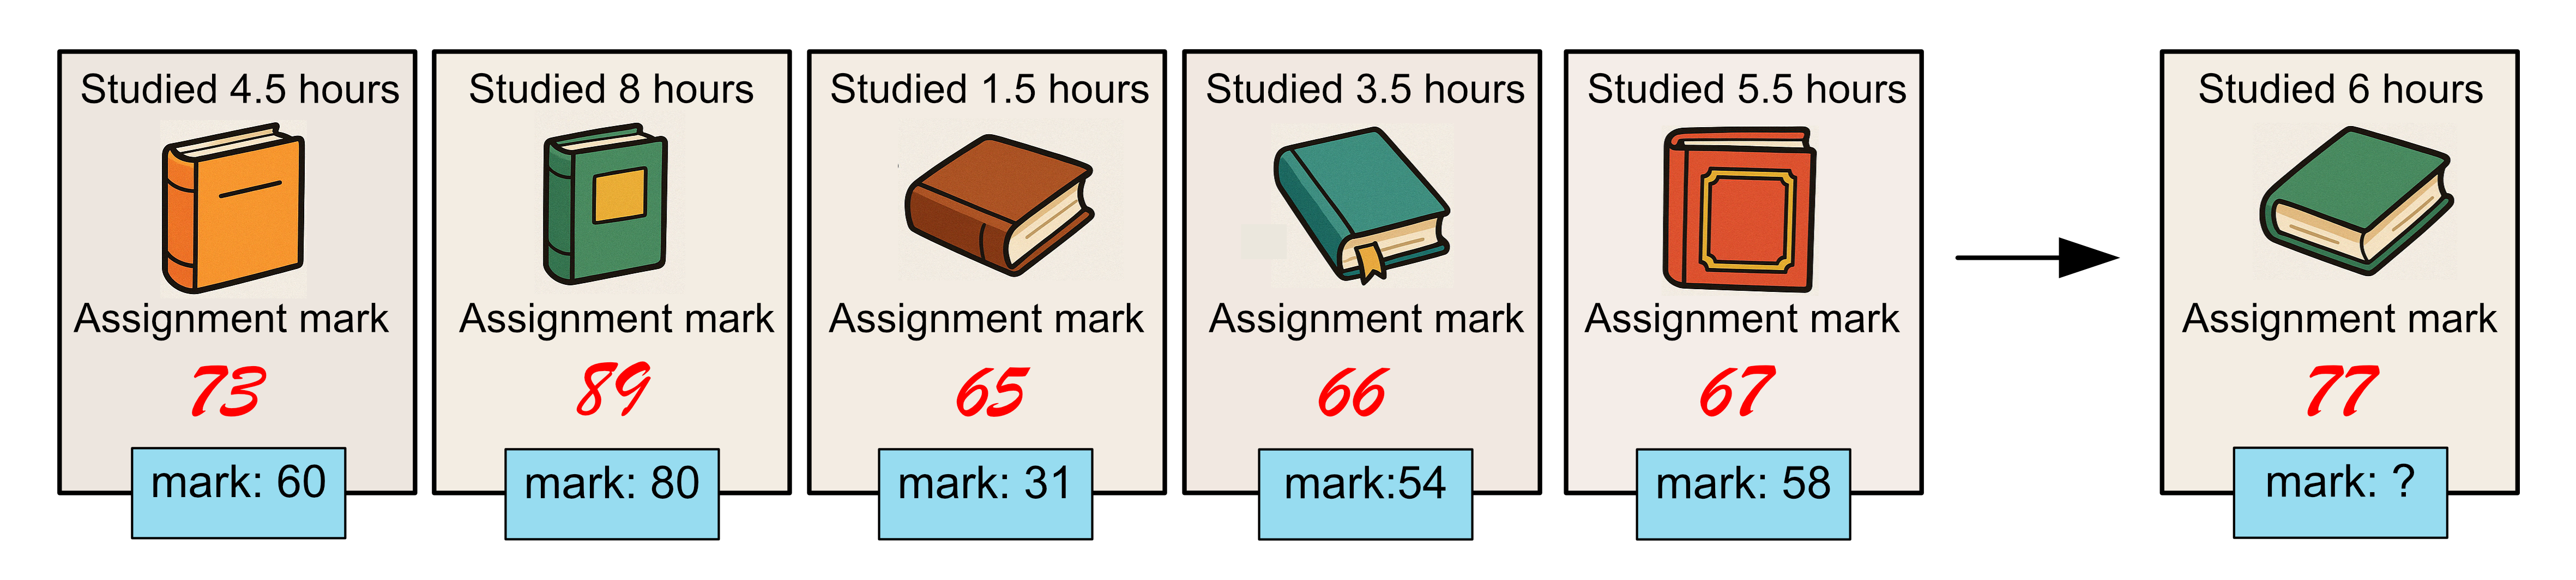
Let’s consider the following dataset:
Time Spent Studying (hours) |
Assignment Mark (%) |
Exam Mark (%) |
|---|---|---|
4.5 |
73 |
60 |
8 |
89 |
80 |
1.5 |
65 |
31 |
3.5 |
66 |
54 |
5.5 |
67 |
58 |
3 |
65 |
30 |
6.5 |
92 |
78 |
In this case we have 2 pieces of information
The amount each student studied
The assignment mark of each student
And our goal is to predict each student’s exam mark.
When we read in the data, we want to read multiple columns into our variable
x. We can do this by using
DataFrame[[column_1, column_2, ...]]
import pandas as pd

data = pd.read_csv("study_assignment.csv")
x = data[["Time Spent Studying (hours)", "Assignment Mark (%)"]].to_numpy()
y = data["Exam Mark (%)"].to_numpy()

print(x)
Output
[[ 4.5 73. ]
[ 8.  89. ]
[ 1.5 65. ]
[ 3.5 66. ]
[ 5.5 67. ]
[ 3.  65. ]
[ 6.5 92. ]]
Recall that previously when we use linear_reg.fit(x, y) that
Note
x: must be a 2D array with \(n\) rows, one for each sample in the
dataset and 1 column. An easy way to achieve this is to use .reshape(-1,
1).
This means -1 rows and 1 column. The -1 will act as a place holder, and numpy will work out how many rows is required based on the specified number of columns, i.e. the data will automatically be reshaped into a column of data.
The code and the process for fitting a linear regression model to this data is
the same as before except that when we call .fit(), we give x as a 2D
array with \(n\) rows, one for each sample in the dataset and 2 columns
since we now have 2 input variables. You’ll have noticed that x already has
the correct dimensions, so we don’t need to reshape the data, but if we did we
would use .reshape(-1, 2).
Below is a complete example, including a prediction for a test student who studied 6 hours and has an assignment mark of 77.
from sklearn.linear_model import LinearRegression
import pandas as pd
import numpy as np

# Load data
data = pd.read_csv("study_assignment.csv")
x = data[["Time Spent Studying (hours)", "Assignment Mark (%)"]].to_numpy()
y = data["Exam Mark (%)"].to_numpy()

# Build linear regression model
linear_reg = LinearRegression()
linear_reg.fit(x, y)

print("intercept: {}".format(linear_reg.intercept_))
print("coefficients: {}".format(linear_reg.coef_))

x_test = np.array([[6, 77]])
print("predicted mark: {}".format(linear_reg.predict(x_test)))
Output
intercept: -9.218654314202688
coefficients: [6.20860485 0.49081416]
predicted mark: [65.82566538]
A few things to note:
The intercept \(\beta_0\) is -9.21
Coefficients is a list containing \(\beta_1\) and \(\beta_2\), \(\beta_1 = 6.21\) and \(\beta_2 = 0.49\)
The equation that describes our model is:
To make a prediction, x_test has dimensions 1 x 2, since there is 1 test samples and 2 input variables
Our model predicts a student who has studied 6 hours and had an assignment mark of 77 will get an exam mark of 65.8.
Code Challenge: Multiple Linear Regression
In addition to the budget of our movies, we also have the release year. Let’s try adding this additional information into our linear regression model. Then, we can evaluate this new model on the test data shown below.
Movie |
Budget ($M) |
Release Year |
Actual Box office ($M) |
|---|---|---|---|
Barbie |
145 |
2023 |
1446 |
Wicked |
150 |
2024 |
752 |
Everything Everywhere All At Once |
25 |
2022 |
143 |
Instructions
Copy and paste in your code from the Measuring Error Using the MSE challenge
Update x so that it is a 2D numpy array with two columns, the first corresponds to
'Budget ($M)'and the second corresponds to'Release Year'Fit your linear regression model ensuring you provide the model x with the correct dimensions
Create a 2D numpy array of the test data, again with the columns corresponding to budget and release year.
Predict the box office results for the test data
Calculate and print the MSE
Your output should look like this:
XXXXXX.XXXXXXXXXX
Things to consider (extension):
As you add more input variables to your model would you expect your model to perform better or worse? Why?
How does the performance of this model (with 2 inputs: budget and release year) compare to the performance of the previous model (with 1 input: budget)?
Can you explain the differences in the performance you observed?
Solution
Solution is locked