4.15. Extension: The K-means Clustering Algorithm#
k-means is a very simple clustering method. It performs surprisingly well in practice, and its simplicity means that it can be applied to massive datasets with ease. The steps for performing k-means clustering are given below.
Set k, the number of groups/clusters
Randomly initialise the centroid of each cluster
Assign each data point to its closest centroid
Set the new centroids to be the mean of each group/cluster
Repeat steps 3-4 until there is no change in the cluster assignments
4.15.1. Visual Walkthrough#
Let’s begin with a simple dataset. What you’ll notice is that none of these samples has a class label, i.e. we don’t start with pre-defined groups. We just have the raw data.

Let’s suppose that this was a dataset of different flowers and for each flower we had the number of petals and the colour.

Step 1: First we set the number of clusters. This is a decision that is entirely up to us. Often when making this decision we will consider:
the purpose of the clustering. E.g. if we were a company analysing our customers, we might only have the budget for 3 major marketing campaigns, so we would want to break our data up into 3 groups, so we would set k = 3.
knowledge of natural groupings in the dataset. E.g. if we were to visualise our data and see 5 distinct groups, we might decide to set k = 5, or if were were to perform clustering on handwritten digits, we know there are only 10 digits (0-9), so we might set k =10.
For this example we’ll choose to set k = 2. That means we will be looking to create 2 groups from our data.
Step 2: Once we have decided on the value of k, we next randomly generate 2 centroids. Here they are shown on our data.

You can think of these centroids as artificial points. You’ll see that the centroids are used so that we can keep track of our groups.
Step 3: Next we assign each data point to it’s closest centroid. For example, the yellow flower is closest to centroid 1.

This means we assign it to group 1.

Let’s do the same for the remaining data points.

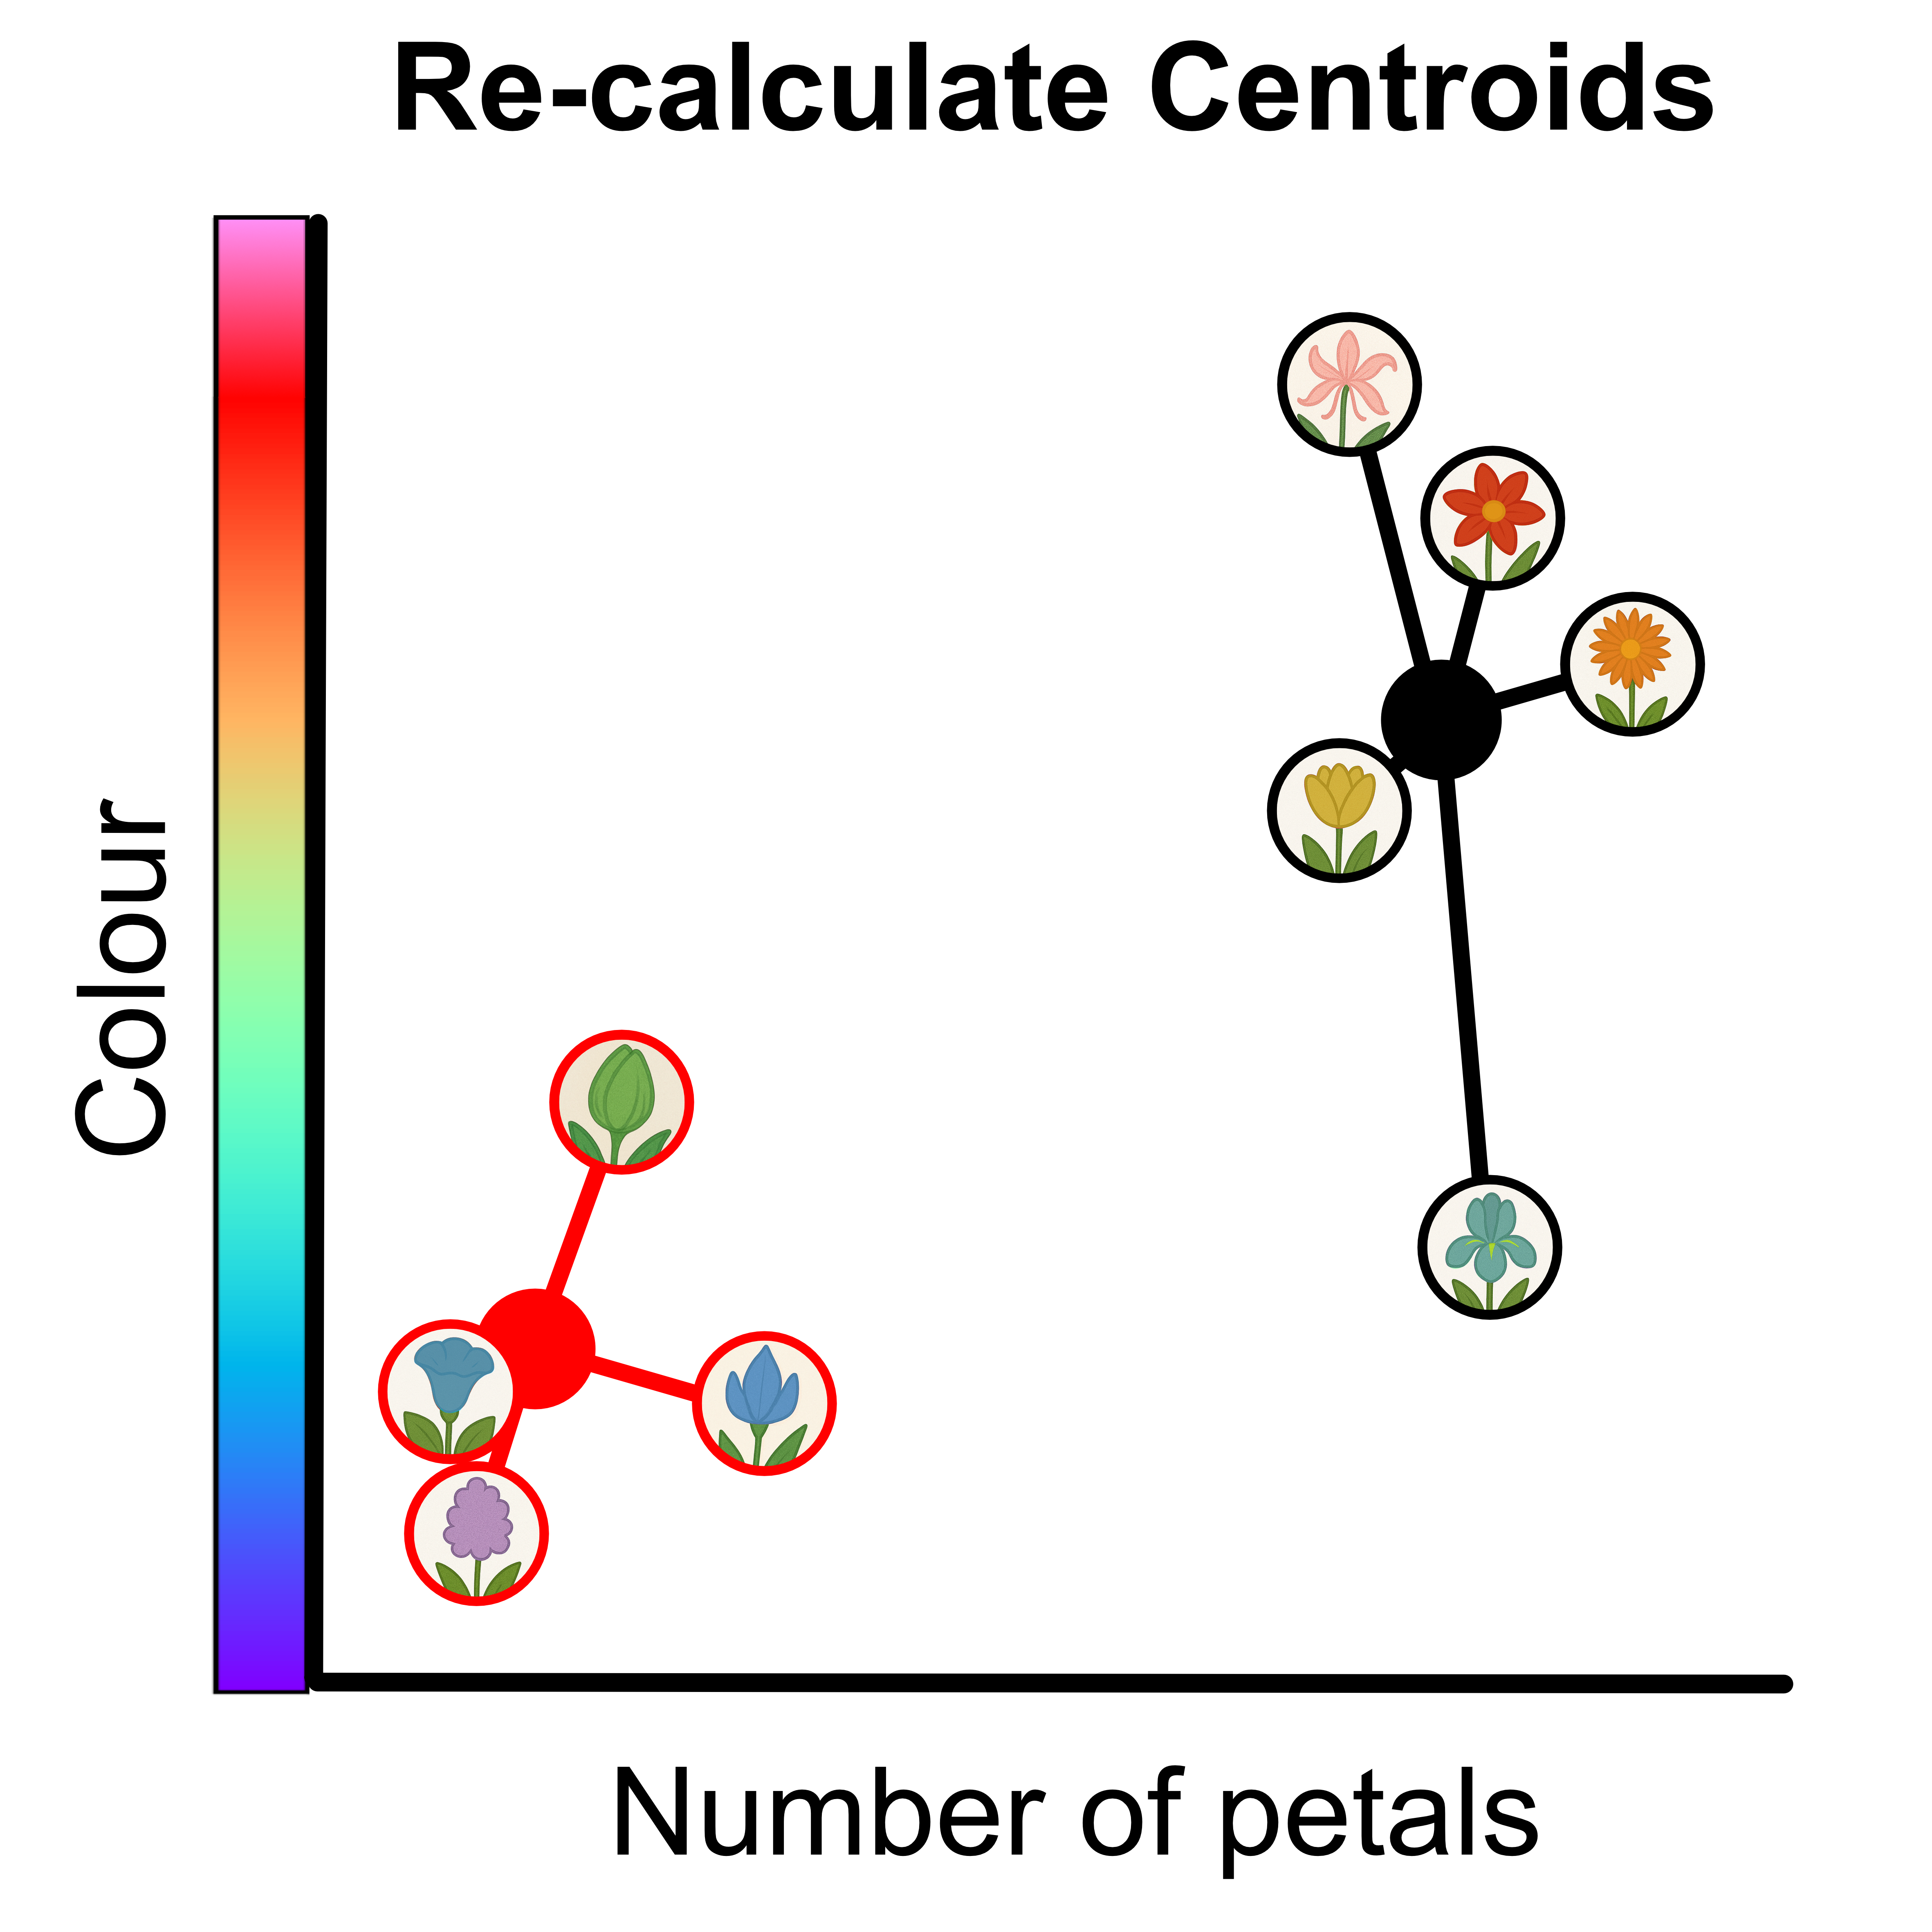
Step 4: Now we re-calculate the centroids to be the mean of each group. To find the new location of centroid 1 we calculate x, the mean x value of all the data points in group 1 and y, the mean y value of all the data points in group 1. We then place centroid 1 at (x, y). We then follow the same process for centroid 2.

Now we repeat steps 3-4.
Step 3: Assign each data point to it’s closest centroid. You will notice that the assignments change. The blue flower with 6 petals has now been allocated to group 1.

Step 4: Now we re-calculate the centroids to be the mean of each group.
Now we repeat steps 3-4.
Step 3: Assign each data point to it’s closest centroid. You will notice that this time the assignments don’t change. If the assignments don’t change it means we’re done!
Here are the final groups. Don’t forget that the centroids are not data points so we remove them from the final results.
