3.14. Interpreting Decision Trees#
As we have seen, decision trees can be used for classification (predicting a class) or regression (predicting a number). In addition to making predictions machine learning models such as decision trees can also be used to gain insights and understand trends in a dataset.
Let’s look at the avocado data. Recall this data contains the following columns:
Month: The month
TotalVolume: The volume of avocados sold that day
Type: The type of avocado we are calculating the average price for (0: conventional, 1: organic)
Year: The year
AveragePrice: The average price of a single avocado on that particular day
Here is the regression tree that was constructed from the data:
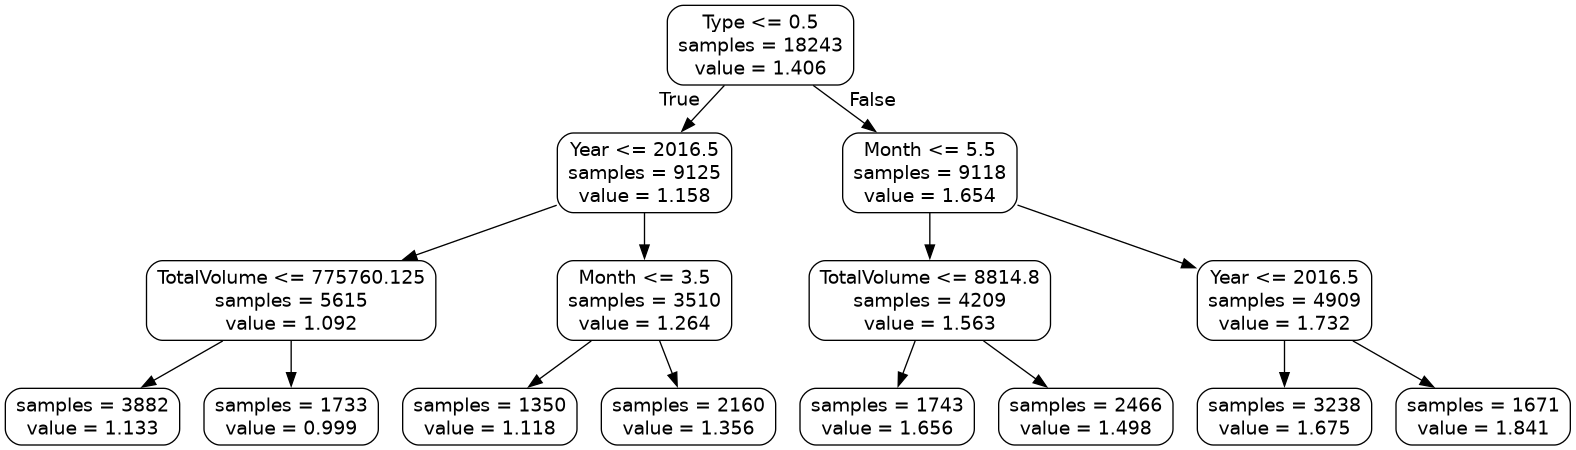
Looking at this diagram we can get an idea of how the model ‘thinks’. You can
see that the first decision this model makes is to split on the type of avocado
Type <= 0.5. Typically the most important features are towards the top of
the tree.
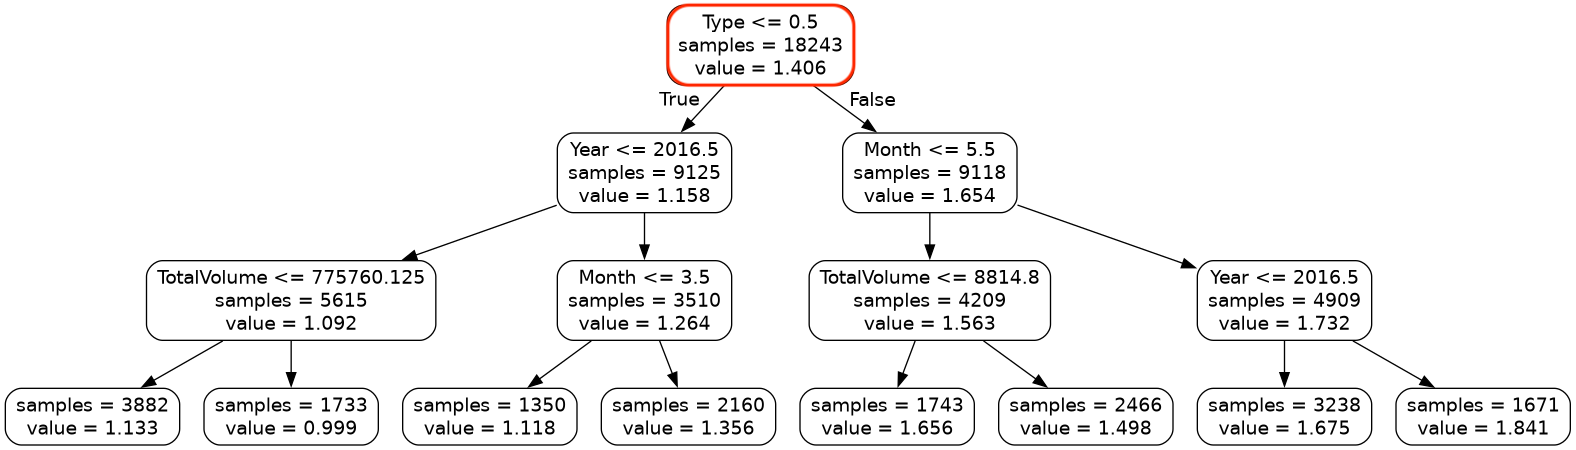
If you look at the values in the leaves, you’ll notice that avocados on the left side of the tree are cheaper than the avocados on the right side of the tree. This leads us to the following insight:
Organic avocados are typically more expensive than conventional avocados
Another trend you’ll notice is that the decision Year <- 2016.5 comes up on
both sides of the tree.
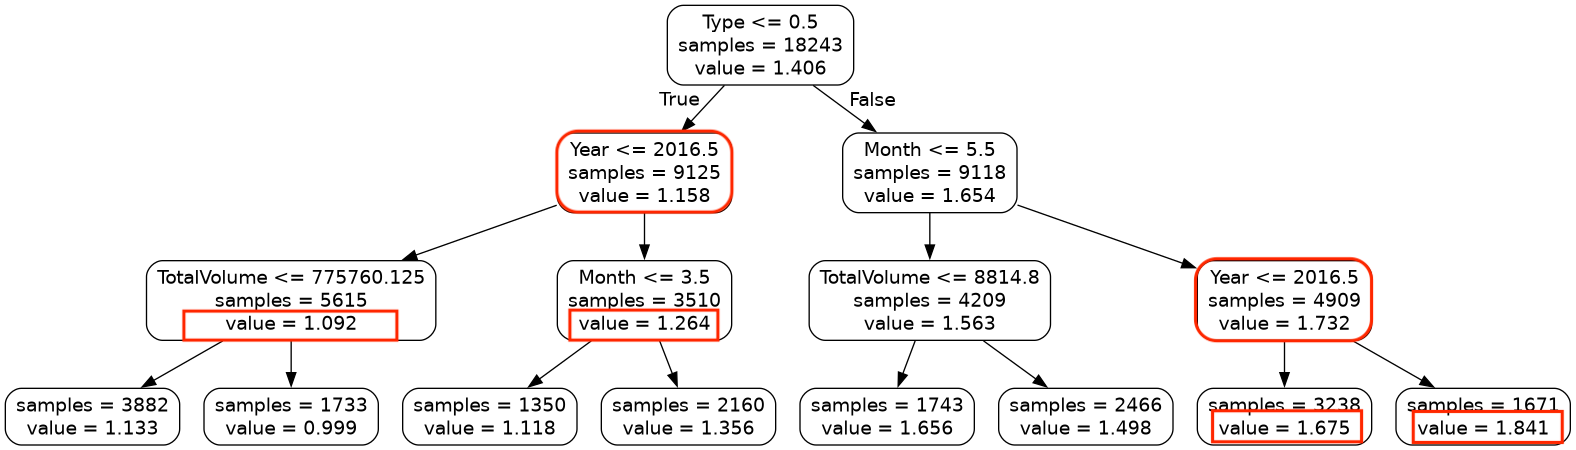
If you look at the average of the avocado values on the left and right side of these splits, you’ll see that avocados on the left are cheaper than avocados on the right. This leads us to the following insight:
Avocados sold in 2017 or later were more expensive that avocados sold in 2016 and before, i.e. the price of avocados have increased
These are just some examples of insights that can be drawn from a decision tree.