1.4. Measuring Error#
When we build our ML models, we need a way to measure how well or poorly the model is performing. We like to summarise a model’s performance using a single number called a metric. One of the most commonly used metrics is the mean squared error (mse).
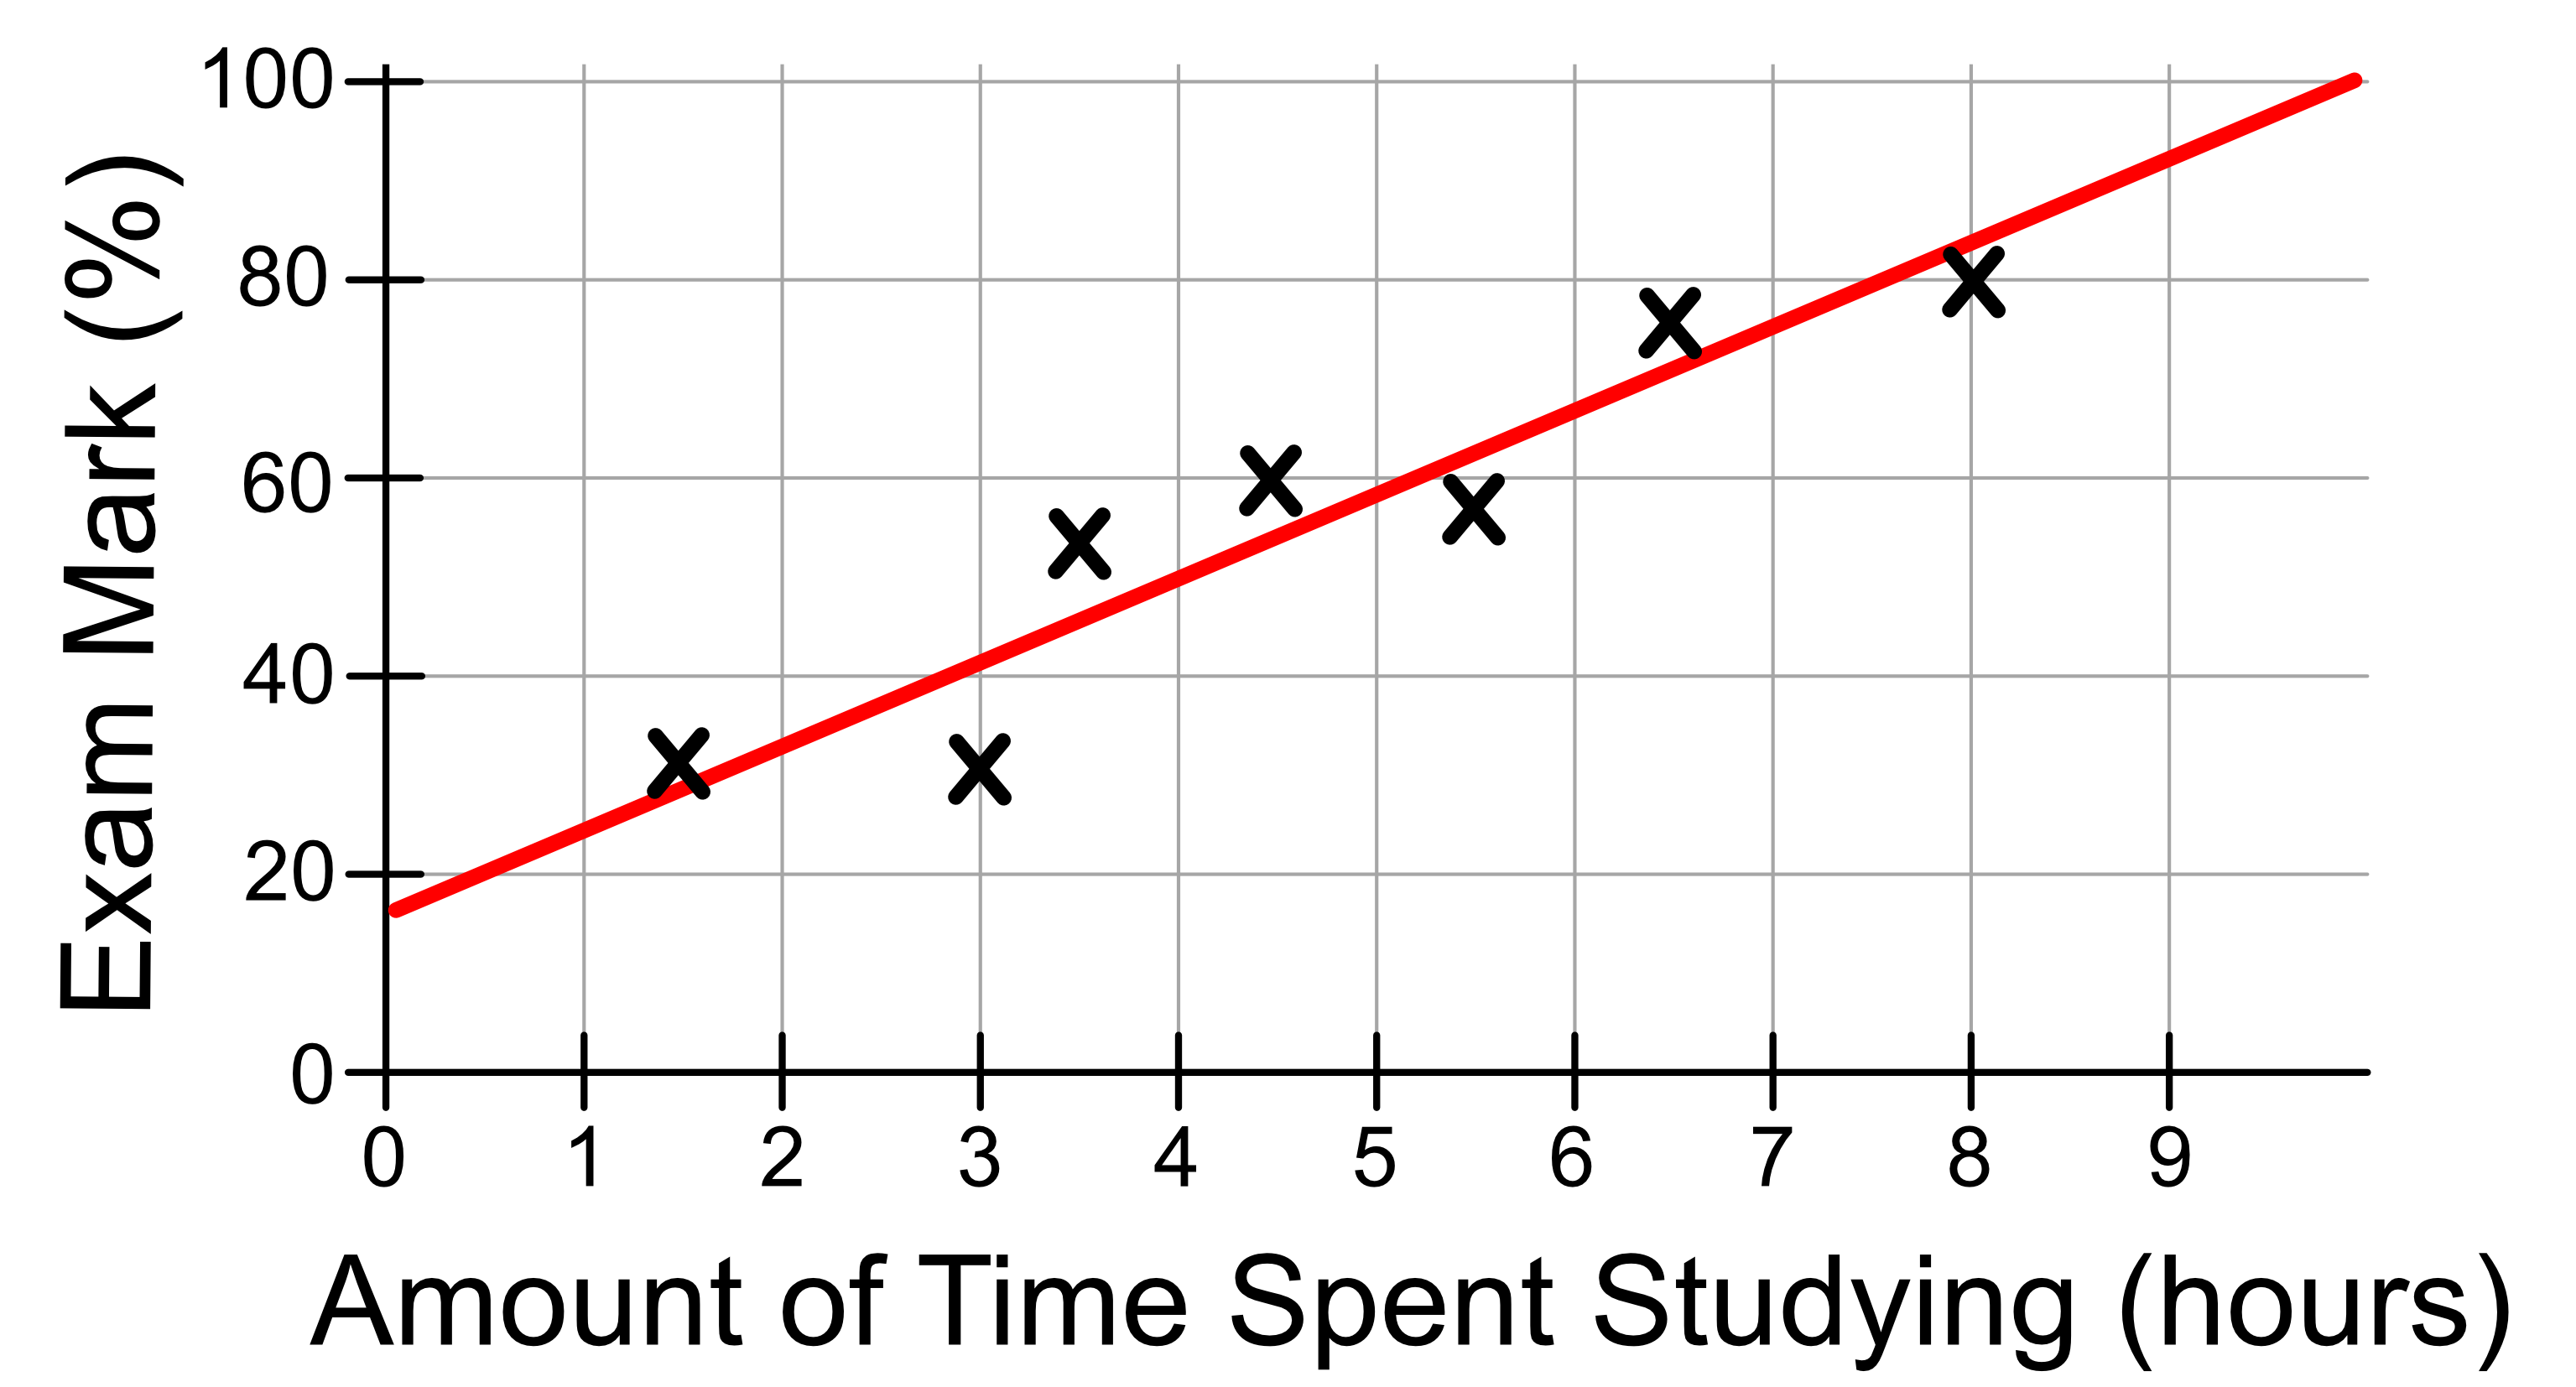
Let’s consider the following linear regression model.
Suppose we had some new data, which we will call test data.
Time Spent Studying (hours) |
Exam Mark (%) |
|---|---|
6 |
? |
2 |
? |
7.5 |
? |
Let’s make a prediction of each of these students’ exam mark using our model. Recall that our model is of the form:
We can sub in values of \(x\) (the time spent studying) to predict \(y\), the exam mark.
Time Spent Studying (hours) |
Predicted Exam Mark (%) |
|---|---|
6 |
67 |
2 |
34 |
7.5 |
80 |
After the students have received their exam mark, we can compare our predicted values with the actual values.
Time Spent Studying (hours) |
Predicted Exam Mark (%) |
Actual Exam Mark (%) |
|---|---|---|
6 |
67 |
71 |
2 |
34 |
35 |
7.5 |
80 |
78 |
The error is the difference between the predicted value and the actual value, i.e. predicted - actual. We can add a new column for the error.
Time Spent Studying (hours) |
Predicted Exam Mark (%) |
Actual Exam Mark (%) |
Error (Predicted - Actual) |
|---|---|---|---|
6 |
67 |
71 |
-4 |
2 |
34 |
35 |
-1 |
7.5 |
80 |
78 |
2 |
To calculate the mean squared error we take all of the error values, square them, and then take the average.
Error values: -4, -1, 2
Square the error values: 16, 1, 4 (note that all of these values are now positive)
Take the average: (16 + 1+ 4)/3 = 7
Hence, our mean squared error is 7.
Generally the goal is to get the mean squared error to be as small as possible. A mean squared error of 0 means that all the errors are 0, and the model obtains perfect prediction! In reality, you’ll never get a perfect model, so you’re just aiming for the mse to be as small as possible.