4.8. Extension: Building a KNN Regression Model#
Building a KNN model using sklearn is very similar to how we have built
previous models.
Let’s first look at our dataset. It contains giraffe data
giraffe.csv. For each giraffe we
have its age in years, its weight in x100kg, its sex (0: female, 1:male) and
its height in m.
import pandas as pd

data = pd.read_csv("giraffe.csv")
print(data)
Output
Age  Weight  Sex  Height
0    1.0     4.0    0     2.7
1    1.7     6.0    1     3.1
2    3.0     5.0    0     3.2
3    3.4     5.5    0     3.3
4    2.4     6.5    1     3.4
5    4.7    10.0    1     4.1
6    5.2     7.0    0     3.7
7    4.5     6.5    0     3.6
8    6.7    13.0    1     4.8
9    7.4    15.0    1     5.2
10   8.1    14.5    1     5.0
11   6.9    19.0    1     5.5
12  10.0    12.0    1     4.9
13  13.0    16.0    1     5.2
14  18.0    13.0    1     4.9
15  22.0    18.0    1     5.3
16   8.0     9.0    0     4.3
17  11.0    11.0    0     4.7
18  15.0    10.0    0     4.5
19  17.0     9.5    0     4.3
20  23.0    11.0    0     4.7
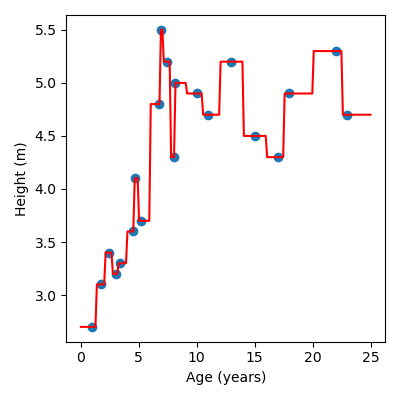
We’ll start by just predicting the height of a giraffe from its age. To build our KNN model we import the model.
from sklearn.neighbors import KNeighborsRegressor
Then we create the model and specify the number of neighbours we want, i.e. the value of k. For now we’ll set k=1.
knn = KNeighborsRegressor(n_neighbors=1)
We fit our model to the data using
knn.fit(x, y)
Note that just like with our linear regression model, x must be a 2D array, so we use .reshape(-1, 1) to get the right dimensions.
We can make predictions using
knn.predict(x)
Again, we need to reshape x. We can use .predict() to visualise our model.
Here is a full example:
Note
Try experimenting with different values of k, i.e. changing the value of
n_neighbors. You should notice that as you increase the number of
neighbours the model looks smoother.
from sklearn.neighbors import KNeighborsRegressor
import matplotlib.pyplot as plt
import pandas as pd
import numpy as np

# Load data
data = pd.read_csv("giraffe.csv")
x = data["Age"].to_numpy()
y = data["Height"].to_numpy()

# Build KNN model
knn = KNeighborsRegressor(n_neighbors=1)
knn.fit(x.reshape(-1, 1), y)

# Create x and y values to visualise the model function
x_model = np.linspace(0, 25, 200)
y_model = knn.predict(x_model.reshape(-1, 1))

# Visualise the results
plt.figure(figsize=(4, 4))
plt.scatter(x, y)  # Data
plt.plot(x_model, y_model, color="red")  # Model
plt.xlabel("Age (years)")
plt.ylabel("Height (m)")
plt.tight_layout()
Output
Code challenge: Extension: Building a KNN Regression Model (k=1)
You have been provided with a csv file called water_intake_train.csv with data obtained from Kaggle. The data contains the following columns:
Calories
Water
We will use the Calories column (the number of calories burned during the exercise) to predict the amount of water the person drank in litres.
Instructions
Using pandas, read the file
water_intake_train.csvinto aDataFrameExtract the
'Calories'column into the variablexExtract the
'Water'column into the variableyConvert both
xandytonumpy arraysUsing
sklearn, create aKNeighborsRegressormodel to fit the training dataSet the value of k, i.e.
n_neighborsto 1Create x and y values to visualise the model.
Use
np.linspace(250, 1750, 1750)to create an array of x valuesUse
.predict()to create a corresponding set of y values
Produce a figure that:
Has figsize (4, 4)
Plots the data as a scatter plot
Plots the KNN regression as a line, in red
Has labels Calories Burned and Water Intake (litres)
Your plot should look like this:
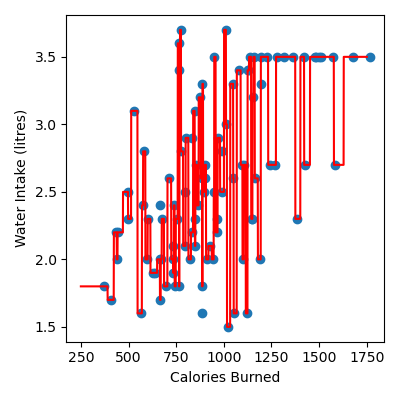
Note
Try experimenting with different values of k and decide which value you think is best!
Solution
Solution is locked