4.12. Extension: Building a KNN Classification Model#
Building a KNN model using sklearn is very similar to how we have built our
KNeighborsRegressor model, except instead of a regressor we use
classifier.
Let’s first look at our dataset views.csv. It contains social score and economic score
of each voter, and the way each voter has voted. There are 5 parties the voters
can vote for:
0: The green party
1: The grey party
2: The red party
3: The blue party
4: The orange party
import pandas as pd

data = pd.read_csv("views.csv")
print(data)
Output
economic    social  vote
0   0.500000  0.500000     2
1   0.625000  0.250000     3
2   0.375000  0.375000     2
3   0.375000  0.625000     0
4   0.625000  0.625000     1
5   0.625000  0.500000     2
6   0.750000  0.375000     3
7   0.750000  0.125000     4
8   0.500000  0.875000     0
9   0.562500  0.312500     3
10  0.750000  0.562500     2
11  0.500000  0.562500     1
12  0.187500  0.750000     0
13  0.437500  0.500000     2
14  0.812500  0.250000     3
15  0.502441  0.260759     2
16  0.255138  0.877244     0
17  0.621183  0.444795     3
18  0.809379  0.457089     3
19  0.898183  0.119172     4
20  0.514586  0.126445     2
21  0.628402  0.958780     0
22  0.478552  0.729356     1
23  0.288511  0.516631     2
24  0.138908  0.893501     0
25  0.398931  0.139958     2
26  0.685574  0.764026     3
27  0.730914  0.194496     4
28  0.482168  0.397233     2
29  0.376092  0.495733     0
30  0.738228  0.763712     1
31  0.247808  0.378422     0
32  0.813439  0.380882     3
33  0.568105  0.443347     3
34  0.459687  0.196591     2
35  0.367975  0.746852     0
36  0.634882  0.540511     1
37  0.758338  0.633532     1
38  0.735519  0.231446     2
39  0.678271  0.243186     4
40  0.253510  0.621930     2
41  0.461919  0.542602     2
42  0.610444  0.733065     1
43  0.757655  0.487665     3
44  0.623316  0.112221     4
45  0.420448  0.168019     3
46  0.632816  0.356909     2
47  0.547329  0.430936     3
48  0.891050  0.479855     3
49  0.516897  0.604805     2
4.12.1. KNN Classification 1D#
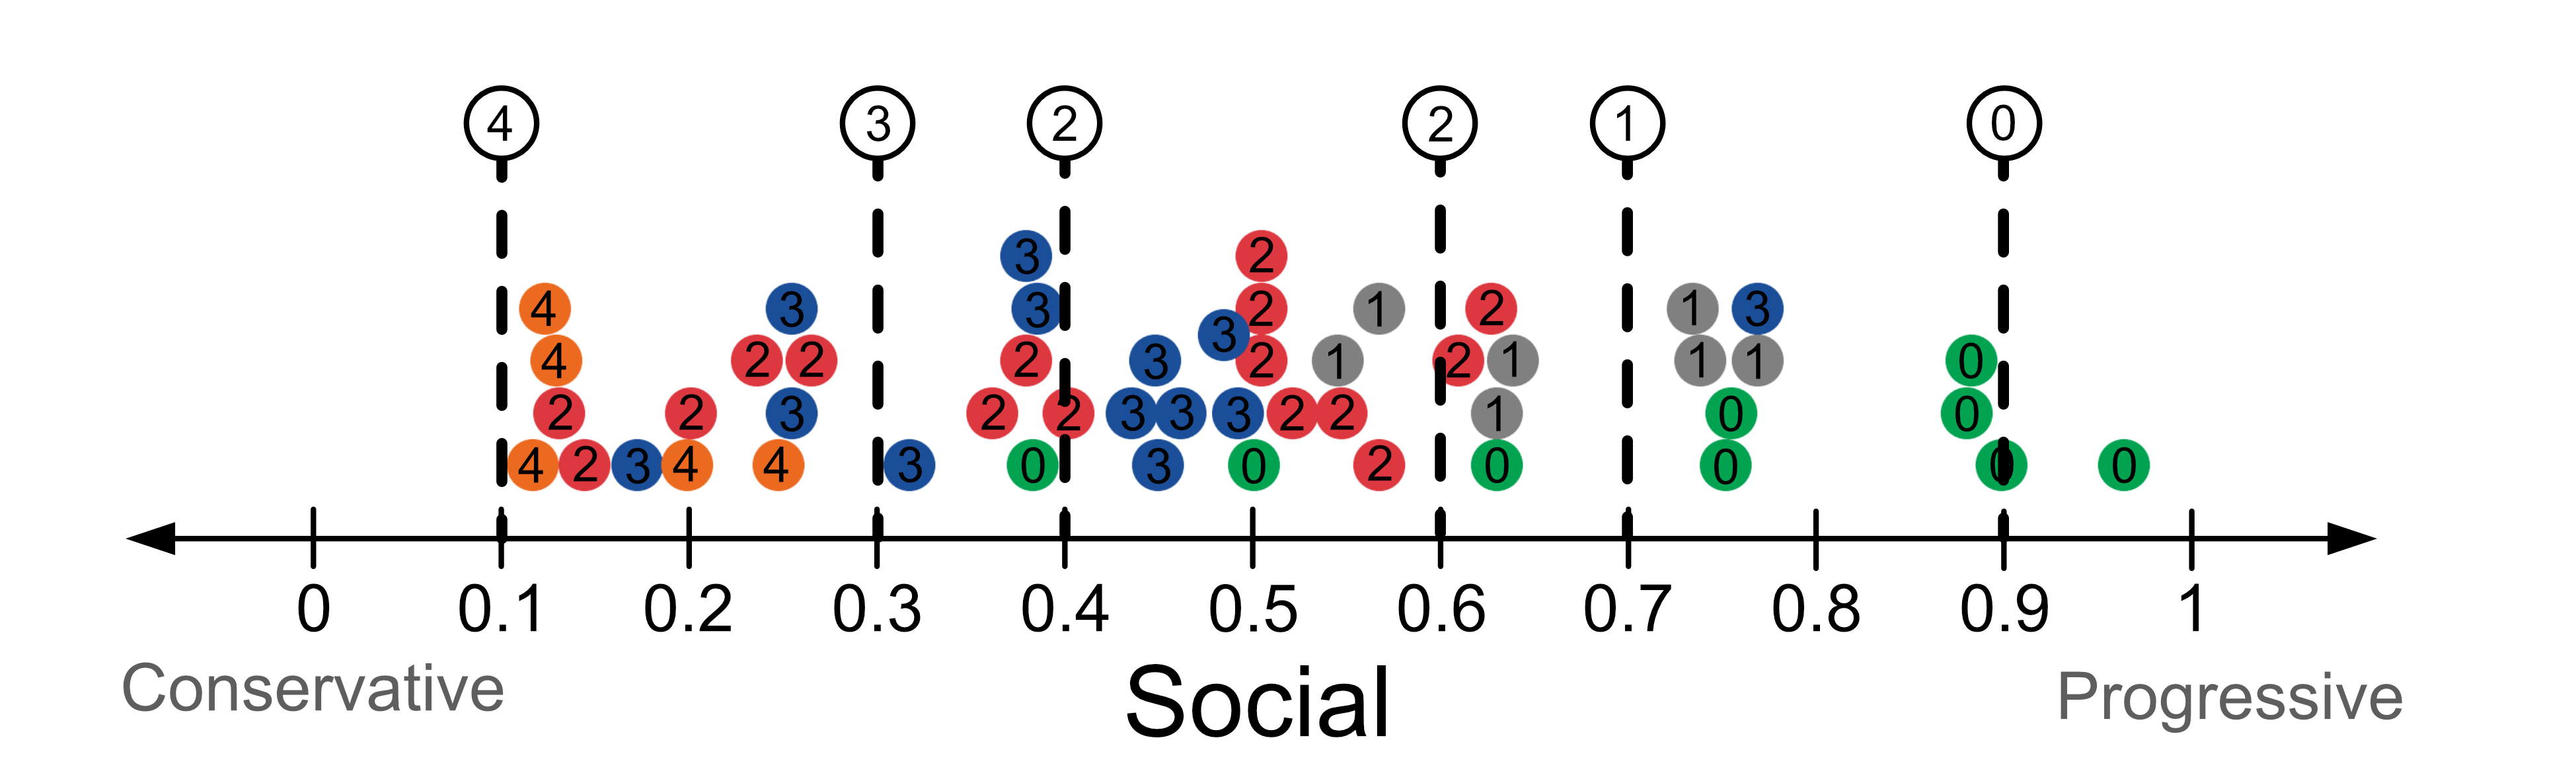
We’ll start by just predicting the party a voter votes for based on their social score. To build our KNN model we import the model.
from sklearn.neighbors import KNeighborsClassifier
Then we create the model and specify the number of neighbours we want, i.e. the value of k. For now we’ll set k=1.
knn = KNeighborsClassifier(n_neighbors=1)
We fit our model to the data using
knn.fit(x, y)
Note that just like with our linear regression model, x must be a 2D array, so we use .reshape(-1, 1) to get the right dimensions.
We can make predictions using
knn.predict(x)
Here is the complete example:
from sklearn.neighbors import KNeighborsClassifier
import pandas as pd
import numpy as np

# Load data
data = pd.read_csv("views.csv")
x = data["social"].to_numpy()
y = data["vote"].to_numpy()

# Build KNN model
knn = KNeighborsClassifier(n_neighbors=1)
knn.fit(x.reshape(-1, 1), y)

# Make prediction
samples = np.array([0.1, 0.3, 0.4, 0.6, 0.7, 0.9])
print(knn.predict(samples.reshape(-1, 1)))
Output
[4 3 2 2 1 0]
The model’s predictions are shown in the table below.
Social Score |
Prediction |
|---|---|
0.1 |
4 |
0.3 |
3 |
0.4 |
2 |
0.6 |
2 |
0.7 |
1 |
0.9 |
0 |
Here’s a visualisation of the predictions.
4.13. KNN 2D#
We can give more than 1 input variable to our KNN classifier model. This is similar to how you would build a multiple linear regression model. When we read in the data, we read multiple columns into our variable x.
DataFrame[[column_1, column_2, ...]]
We then need to reshape our data using .reshape(-1, N), where N is the
number of input variables. In the 2D case, N is 2.
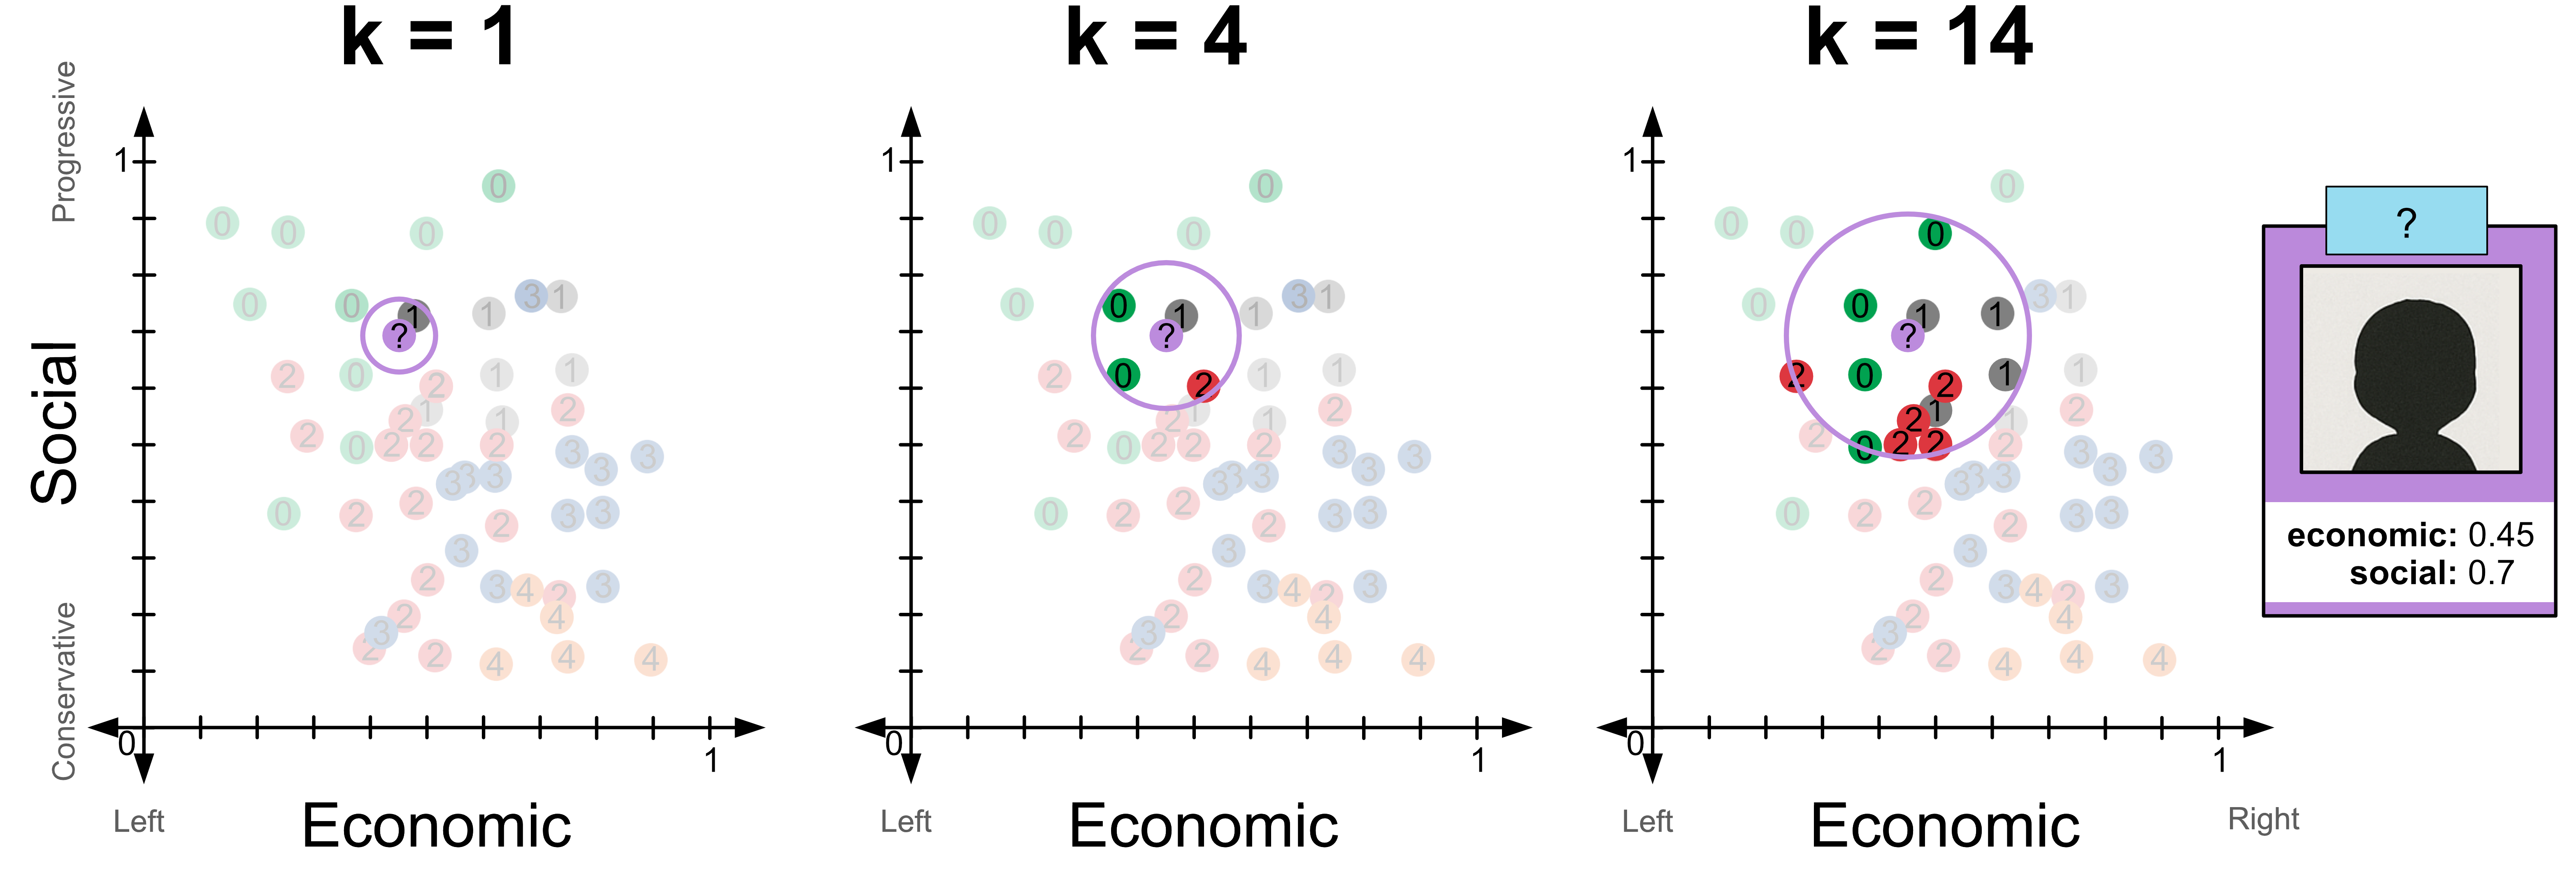
Here’s a complete example where we give the social score and economic score. We have also provided the test sample (0.45, 0.7).
from sklearn.neighbors import KNeighborsClassifier
import matplotlib.pyplot as plt
import pandas as pd
import numpy as np

# Load data
data = pd.read_csv("views.csv")
x = data[["economic", "social"]].to_numpy()
y = data["vote"].to_numpy()

# Build KNN model
knn = KNeighborsClassifier(n_neighbors=1)
knn.fit(x.reshape(-1, 2), y)

# Make prediction
samples = np.array([0.45, 0.7])
print(knn.predict(samples.reshape(-1, 2)))
Output
[1]
Try changing the value of k from 1 to 4. You should see that
for k=1 the model predicts 1
for k=4 the model predicts 0
for k=14 the model predicts 2
Here’s a visualisation of these predictions.
Code challenge: Extension: MNIST KNN classification
The MNIST dataset is one of the most famous datasets in machine learning, and is often used to benchmark models. It contains 28x28 pixel images of handwritten digits. We have obtained a csv copy of the dataset from Kaggle , but have provided a smaller version of the data here.
Your tasks is to build a KNN classification model and to use it to classify the five samples provided in the test dataset. These images are provided below.
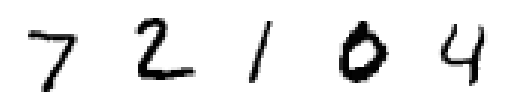
You have been given code that reads in the data into x_train, y_train, x_test and y_test mnist_data.zip. You have also been provided with a function called visualise that you can use to view individual samples. We have provided an example visualisation of the first sample in the training set.
import pandas as pd
import matplotlib.pyplot as plt
from sklearn.neighbors import KNeighborsClassifier

def visualise(img):
   img = img.reshape(28,28)
   plt.imshow(img, cmap='binary')
   plt.axis('off')
   plt.savefig('plot')

x_train = pd.read_csv('mnist_train_x.csv').to_numpy()
y_train = pd.read_csv('mnist_train_y.csv').to_numpy().flatten()
x_test = pd.read_csv('mnist_test_x.csv').to_numpy()
y_test = pd.read_csv('mnist_test_y.csv').to_numpy().flatten()

# Visualisation of the first training sample
visualise(x_train[0])

# YOUR CODE GOES HERE
Instructions
Using
sklearn, create aKNeighborsClassifiermodel to fit the training dataSet the value of k, i.e.
n_neighborsto 10Fit this model to the training data. Note that for a 28x28 pixel image the data should contain 784 columns.
Use the KNN model to predict the labels of the five samples in the test data.
Your output should look like this:
[X X X X X]
Solution
Solution is locked