3.9. Extension: Predicting With a Classification Tree#
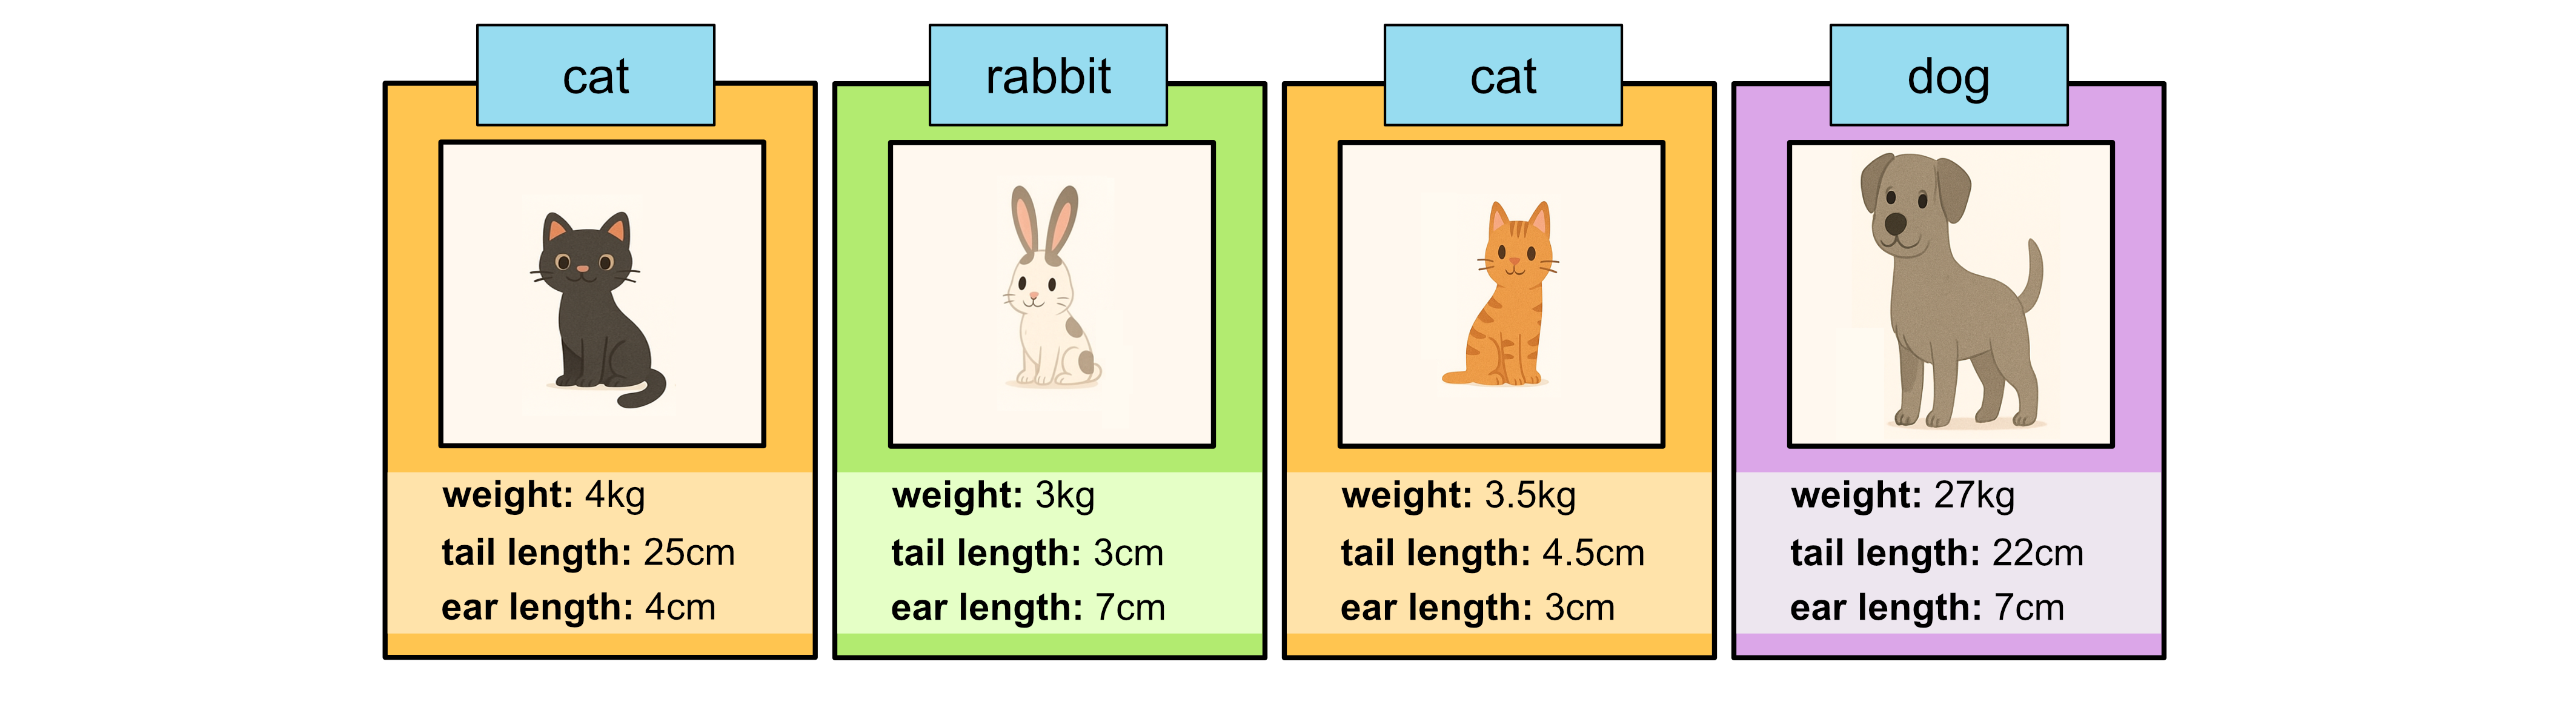
Consider the following test data:
Weight (kg) |
Tail Length (cm) |
Ear Length (cm) |
Class |
|---|---|---|---|
4 |
25 |
4 |
cat |
3 |
3 |
7 |
rabbit |
3.5 |
7 |
3 |
cat |
27 |
22 |
7 |
dog |
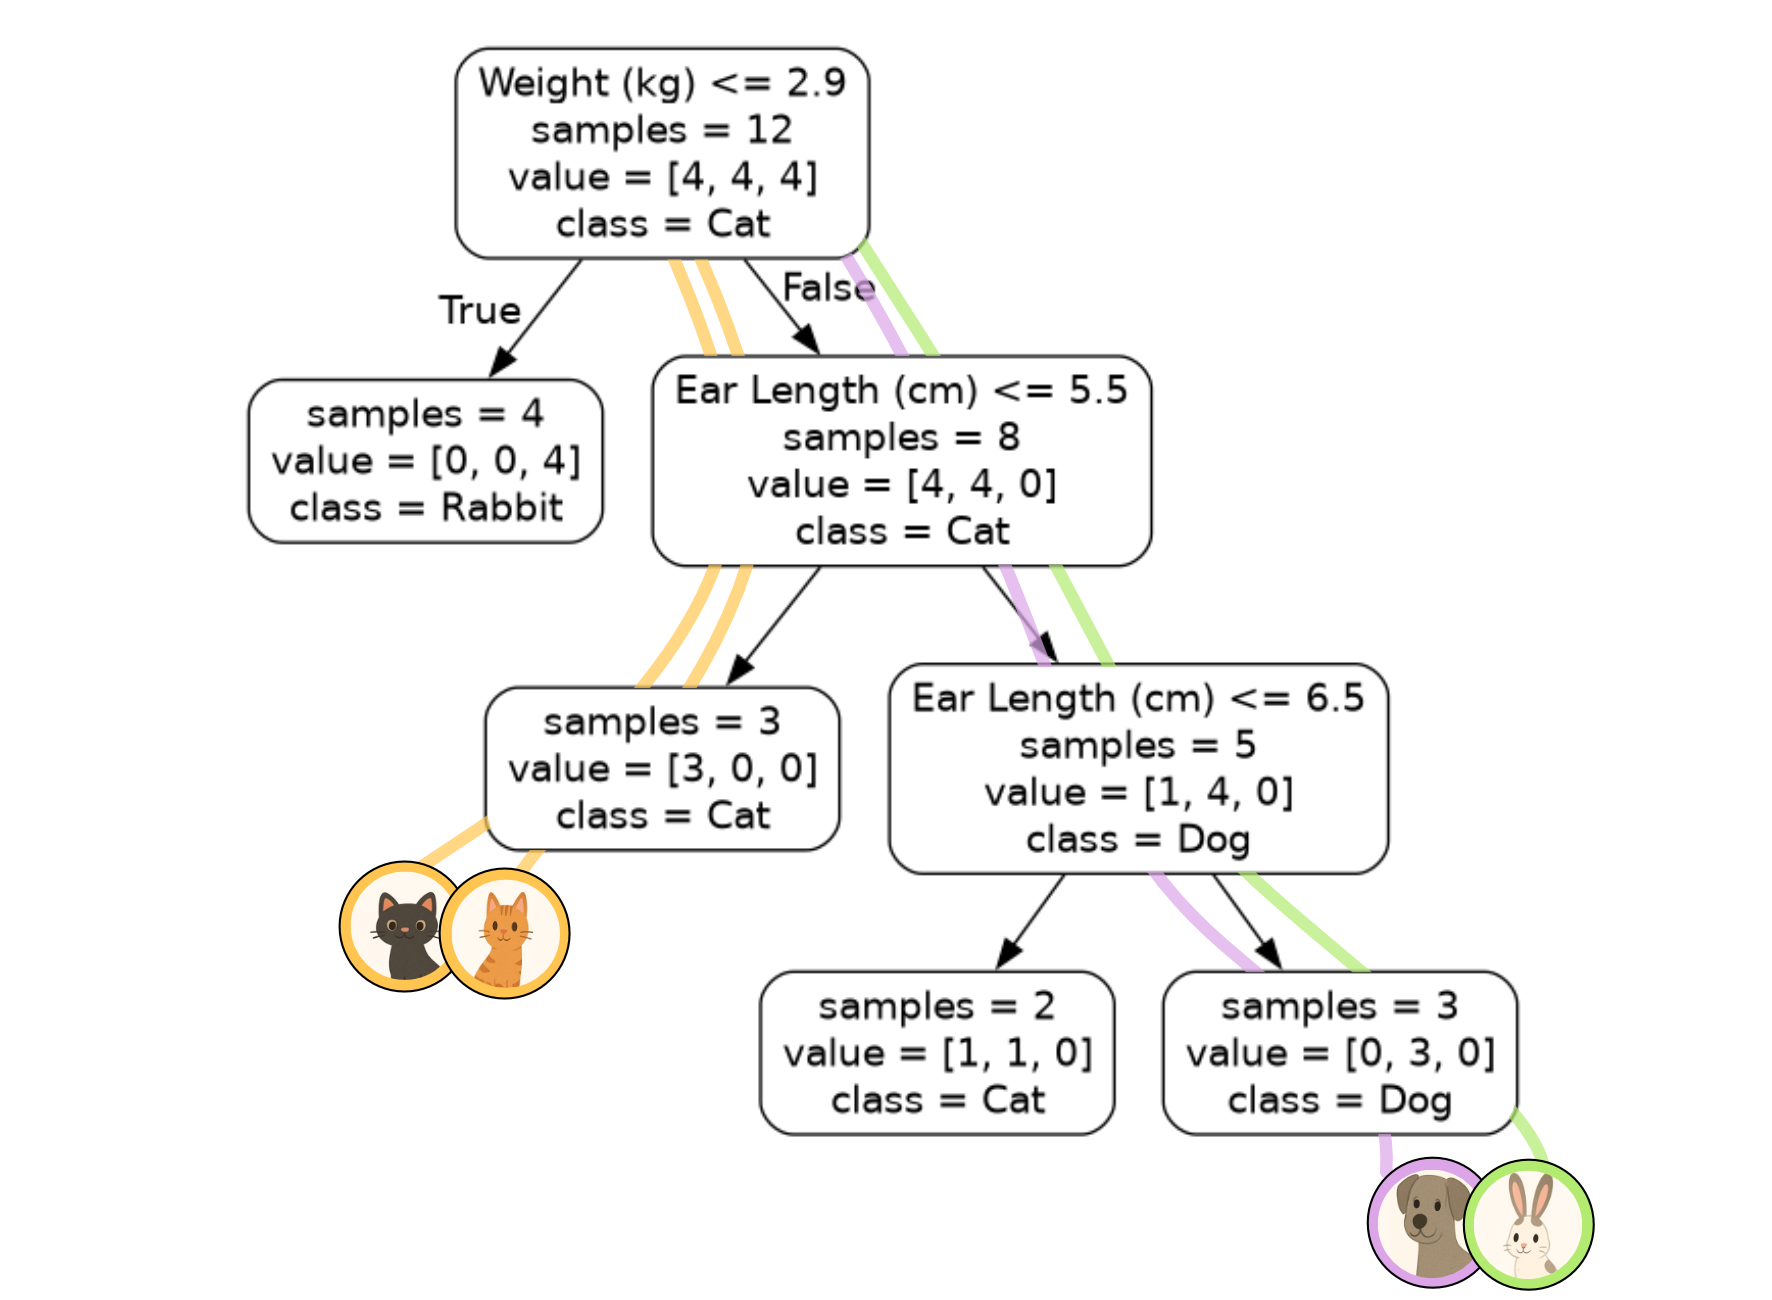
We can use .predict(x) to use our decision tree classifier to predict the
classes of our test data. We just need to remember to provide the test inputs
as a 2D array where the columns correspond to each input variable and the rows
correspond to each sample.
import pandas as pd
import numpy as np
from sklearn.tree import DecisionTreeClassifier

data = pd.read_csv("animals.csv")
x = data[["Weight (kg)", "Tail Length (cm)", "Ear Length (cm)"]].to_numpy()
y = data["Class"].to_numpy()

tree = DecisionTreeClassifier(max_depth=3)
tree.fit(x, y)

# weight, tail, ear
x_test = np.array([[4, 25, 4], [3, 3, 7], [3.5, 4.5, 3], [27, 22, 7]])

prediction = tree.predict(x_test)
print(prediction)
Output
[0 1 0 1]
We can see the prediction is
[0, 1, 0, 1]
This means:
the first sample has been classified as class 0: cat
the second sample has been classified as class 1: dog
the third sample has been classified as class 0: cat
the fourth sample has been classified as class 1: dog
We can verify these predictions with the models ourselves as well using the diagram.
Code Challenge: Extension: Predicting with a Classification Tree
Now lets use the classification tree we just built on our astronomy data astronomy.csv to classify the astronomical objects in our test data.
Name |
Mass (Earths) |
Density (g/cm:math:^3) |
|---|---|---|
Kepler 1649 |
1.2 |
5.54 |
Eris |
0.0027 |
2.43 |
Io |
0.015 |
3.53 |
Miranda |
0.00001 |
1.15 |
TrES 4b |
248 |
0.16 |
Instructions
Copy and paste in your code from Extension: Interpreting The Output Graph, just up to where you fit the classification tree
Create a
numpy arraycontaining the astronomy data shown aboveUse
.predictto predict the class for each objectPrint the predictions
Your output should look like this:
[X X X X X]
Solution
Solution is locked